
A patient is admitted to your ICU at 2 AM with suspected urosepsis. You order the standard workup. CBC, KFT, LFT, lactate, blood cultures, procalcitonin. The labs go to the central lab because your hospital, like most hospitals in India, does not have a dedicated ICU stat lab running 24/7. The results come back at 3:45 AM, almost two hours after admission.
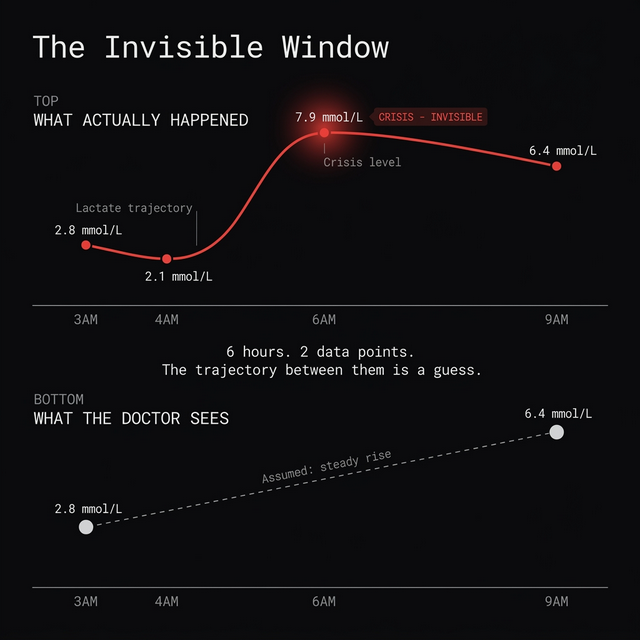
Lactate is 2.8 mmol/L. Elevated, concerning, but not catastrophic. You start empiric antibiotics and fluids. You order repeat labs in 6 hours.
At 10 AM, the repeat lactate comes back at 6.4. Already stale by the time you see it on rounds.
Something went very wrong between 3 AM and 9 AM. But you have no idea what.
You have two data points separated by six hours. You know where the patient was. You know where the patient is. You have absolutely no idea what happened in between. The trajectory between those two measurements is invisible to you.
You are reconstructing it in your head right now, probably assuming a steady rise from 2.8 to 6.4 over six hours. A clean upward slope.
What if that is not what happened?
What if the lactate was 2.8 at 3 AM, dropped to 2.1 by 4 AM (the antibiotics were working), then spiked to 7.9 by 6 AM (resistant organism, wrong coverage), and was already coming back down to 6.4 by 9 AM because the patient's own compensatory mechanisms kicked in?
In that version, the patient had a crisis at 6 AM that you never saw, the antibiotics failed three hours ago, and the current 6.4 is actually a recovery signal from a peak you never measured.
The clinical decision for a steady rise from 2.8 to 6.4 is completely different from the clinical decision for a spike to 7.9 that is already resolving. One requires escalation. The other requires observation. You are choosing between them with zero information about what actually happened.
This is a sampling theory problem, not a technology problem, and it has been hiding in plain sight for decades.
1The Nyquist violation
There is a theorem in signal processing that most engineers learn in their second or third year of undergrad. The Nyquist - Shannon sampling theorem. It says something simple: if you want to accurately reconstruct a signal, you need to sample it at a frequency that is at least twice the frequency of the fastest change in that signal.
Sample below that rate and you get aliasing: the signal you reconstruct looks real and plausible enough to make decisions on, and it is wrong. It is a mathematical artifact of undersampling. And there is no way to detect the error from the samples alone because the aliased signal is internally consistent.
Now apply this to the ICU.
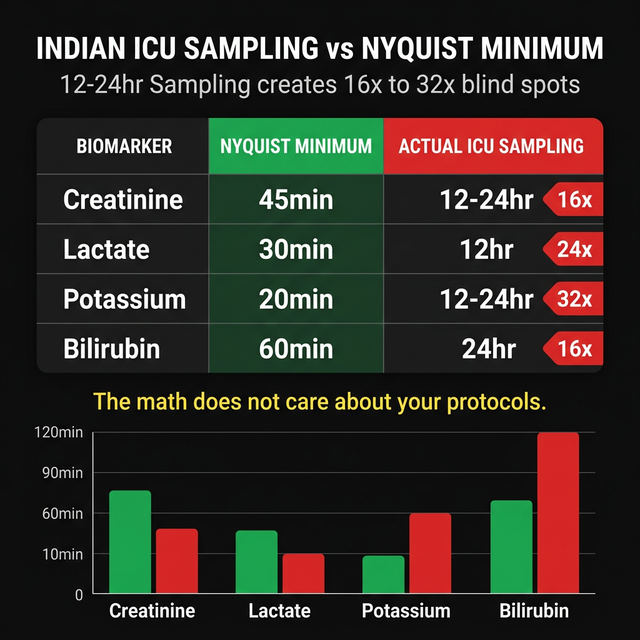
Acute kidney injury during septic shock with concurrent nephrotoxic drug exposure can transition from KDIGO Stage 1 to Stage 3 in 90 minutes. The creatinine trajectory during this transition has frequency components on the order of 1 cycle per 90 minutes. Nyquist says you need to sample at minimum every 45 minutes to have any hope of reconstructing what happened.
Now here is the part that should terrify you.
The textbooks say "blood draw every 4 to 6 hours." That would already be a 5 to 8 times Nyquist violation. But that is the textbook. The reality in Indian ICUs, including top tier corporate hospitals, is far worse.
ABGs are drawn once every 12 hours. Liver function, renal function, procalcitonin, bilirubin, coagulation panels? Once every 24 hours. Sometimes once every 48 hours if the attending decides "there won't be any meaningful change."
For a 90 minute AKI transition with creatinine panels done every 24 hours, the violation factor is not 5x but 32x. You would need to sample every 45 minutes. You are sampling every 1,440 minutes.
The math does not care about your protocols, your hospital's cost structure, or what the attending thinks about meaningful change. At a 32x Nyquist violation you are no longer undersampling the signal, you are failing to observe it at all.
2The real timeline
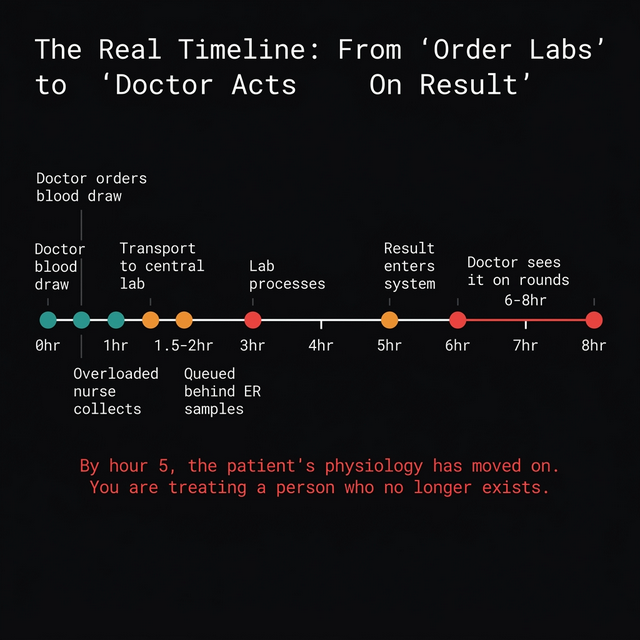
And it gets worse. The 4 to 6 hour sampling rate is not even the real number. That is when the blood draw is ordered. In most Indian hospitals, the sample has to be collected by an already overloaded nurse (or a junior resident if the nurse is busy with another patient), transported to a central lab that serves the entire hospital (not just the ICU), queued behind ER and surgical samples, processed, reported into whatever system the hospital uses (paper charts in many tier 2 and tier 3 cities), and then the attending has to physically see it during rounds or get a phone call if it is critical.
By the time a clinician acts on a lab value, the measurement can easily be 8 to 12 hours old. The patient you are treating has already moved to a completely different physiological state.
You are treating yesterday's patient.
3Who decided these frequencies?
Someone decided these sampling frequencies. Who?
This is the part that should make you uncomfortable. The standard frequencies for ICU lab monitoring were not derived from any analysis of physiological signal dynamics. They were not designed to satisfy Nyquist or any other sampling criterion. They were determined by a combination of practical constraints (lab turnaround time, phlebotomy staffing, blood volume limitations) and clinical tradition (this is how we have always done it).
The frequencies became protocols. The protocols became standard of care. Standard of care became legal protection. And nobody went back to ask: is this sampling rate mathematically sufficient to detect the things we need to detect in time to act on them?
The answer is no. It is not even close.
Consider what a 12 to 24 hour sampling gap means for different clinical scenarios:
- Septic shock can produce a lactate doubling time of 60 to 90 minutes during fulminant presentation. With ABGs done every 12 hours, you could have 8 lactate doublings between measurements.
- Dengue hemorrhagic fever can produce platelet crashes from 80,000 to below 10,000 in under 3 hours. With CBC done once every 24 hours, the entire hemorrhagic crisis happens in a blind spot.
- Snake envenomation (Russell's viper) can push potassium to lethal concentrations in under 2 hours.
- Scrub typhus with multi-organ involvement can swing from compensated to decompensated in a single shift.
- Troponin rises from acute coronary occlusion can peak and begin resolving within a 4 hour window.
Each of these scenarios has physiological frequency components that are significantly faster than the sampling rate can capture. The result is exactly what Nyquist predicted: aliasing.
4The trajectory problem
There is another dimension to this that nobody talks about. A creatinine value of 2.1 mg/dL means something entirely different depending on the trajectory that produced it.
If the patient's creatinine was 1.0 yesterday and is 2.1 today, that is a steep rise and demands immediate action. If the patient's creatinine was 3.8 yesterday and is 2.1 today, that is a recovery signal and demands patience.
The same number carries the opposite clinical meaning.
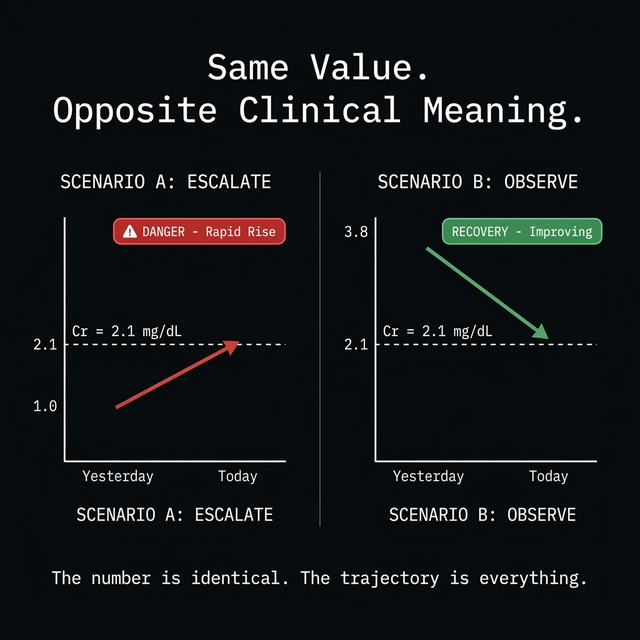
The absolute value is what gets reported, flagged, and alarmed on. The trajectory is what determines whether the patient lives.
Now extend this across 10 organ systems, 20+ parameters, multiple concurrent interventions each with their own pharmacokinetic timelines, and organ systems that are coupled to each other (renal function affects drug clearance which affects hepatic load which affects coagulation which affects everything else).
The intensivist is supposed to track all of this mentally, with data points arriving at different times, from different labs, with different delays, for 15 patients simultaneously. It is an impossible task that we have normalized because we have never had an alternative.
5The aliased evidence base
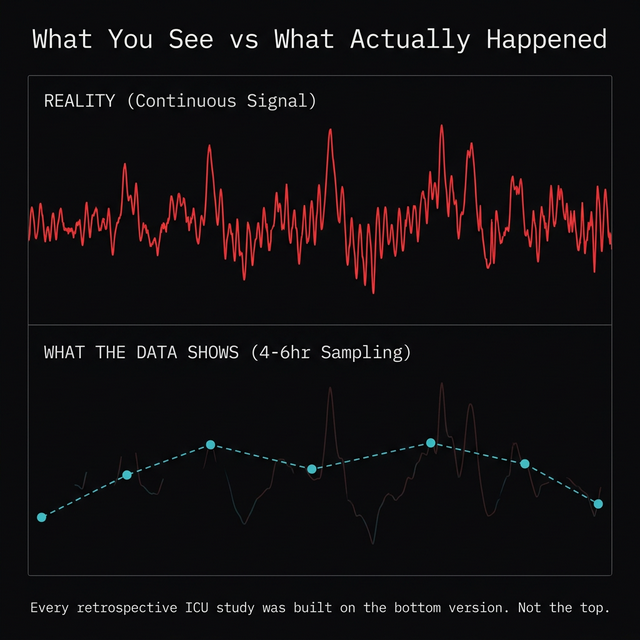
The sampling problem has a specific mathematical consequence that is worth understanding clearly. When you sample a continuous signal below the Nyquist rate, the high frequency components of the signal fold back into the low frequency spectrum. This is aliasing. The reconstructed signal appears to have dynamics that do not exist in the original signal, and the real dynamics become invisible.
You cannot fix aliasing after the fact. No amount of post-processing, no statistical method, no machine learning model can recover the original signal from undersampled data. The information was lost at the point of sampling. It never entered the dataset.
This means that every retrospective study, every clinical trial, every EHR-based analysis of ICU outcomes is working with aliased data. The physiological trajectories in these datasets are not the true trajectories. They are the aliased reconstructions created by 4 to 6 hour sampling rates. The patterns found in this data, the risk scores built on it, the protocols derived from it - all of them are operating on a mathematical artifact.
The entire evidence base for ICU monitoring and intervention timing is built on data that violates the most basic theorem in signal processing.
6The question
The uncomfortable truth is that the technology to sample at clinically adequate frequencies has existed for years. Continuous glucose monitors sample every 5 minutes. Continuous pulse oximetry samples many times per second. The bottleneck is biochemical testing, not sensing technology.
Blood gases, metabolites, renal markers, hepatic markers, cardiac markers, inflammatory markers. These require a blood sample, a lab, a processing pipeline, and a reporting system that was designed in an era when the fastest available turnaround was measured in hours.
Nobody redesigned the sampling pipeline because the protocols were already set. The protocols were set because the turnaround times were fixed. The turnaround times were fixed because the lab infrastructure was built that way. And the lab infrastructure was built that way because nobody asked what sampling rate the physiology actually demands.
Circular reasoning that has been codified into clinical practice and protected by legal precedent.
Somewhere inside those invisible windows, between the blood draw and the lab result and between the last measurement and the next, patients are crossing thresholds that nobody sees. Organs are deteriorating along trajectories that nobody tracks. Interventions are arriving too late for patients who could have been saved if anyone had known what was happening 90 minutes ago.
The information exists inside the patient. It has always been there.
The question is whether medicine is willing to go and get it at the frequency the physiology demands.
So far, the answer has been no.
Declarations
Competing interests. The author is the founder of Aethryva Deeptech, which develops the tachyDx platform and the MOISSCode language. Where an article in this series mentions either, it says so in the text and the mention follows the argument.
Sources and figures. This article argues from first principles and from the author's own published work, and carries no reference list. Figures are schematic. Articles in the series from April 2026 onward cite open access sources only.
Cite this article
Kunche N. You are treating yesterday's patient. The Intervention. 6 March 2026. https://nikhilkunche.com/blog/you-are-treating-yesterdays-patient
Comments