
You are staring at a monitor. Creatinine: 2.1 mg/dL. The number is red because it crossed the threshold your EHR was configured to flag. A little arrow points up. The system has done its job. It told you a number. It told you the number is high. It even told you the direction since the last measurement.
What it did not tell you is the only thing that actually matters.
Is this patient's kidney failing or recovering?
A creatinine of 2.1 in a patient who was 0.9 two days ago is a kidney in freefall. The velocity is positive, steep, and accelerating. That patient needs imaging, needs a nephrology consult, probably needs you to stop whatever nephrotoxic agent you started 36 hours ago. Every hour you wait, the damage compounds.
A creatinine of 2.1 in a patient who was 4.6 three days ago is a kidney clawing its way back. The velocity is negative, the trajectory is recovery, and the best thing you can do is stay out of the way. Observe. Let the organ do what it is trying to do.
The same number, the same red flag and the same upward arrow (because the last measurement before this one might have been 1.9, caught on the downslope of a much larger curve you never saw) describe a completely opposite clinical reality. The monitor shows you a snapshot. The patient is a trajectory. And you are making life or death decisions based on the snapshot because that is all anyone ever gave you.
A score that cannot distinguish between a patient who is crashing and a patient who is recovering is a rounding error with a validation study, not a clinical tool.
This is every patient, every lab value and every hour of every ICU shift, not an edge case. The absolute number is what gets displayed, reported, flagged, alarmed on, and charted. The trajectory is what determines whether the patient survives. The entire monitoring infrastructure of modern critical care is built around the wrong variable.
1Position without velocity
There is a concept in physics that every first year undergrad learns. Position tells you where something is. Velocity tells you where it is going. Acceleration tells you how fast the situation is changing. You need all three to predict what happens next. Nobody in physics would look at a position measurement alone and try to predict the future state of a moving object. That would be absurd.
Medicine does this routinely.
We built a speedometer that only shows your location. Then we wondered why we keep crashing.
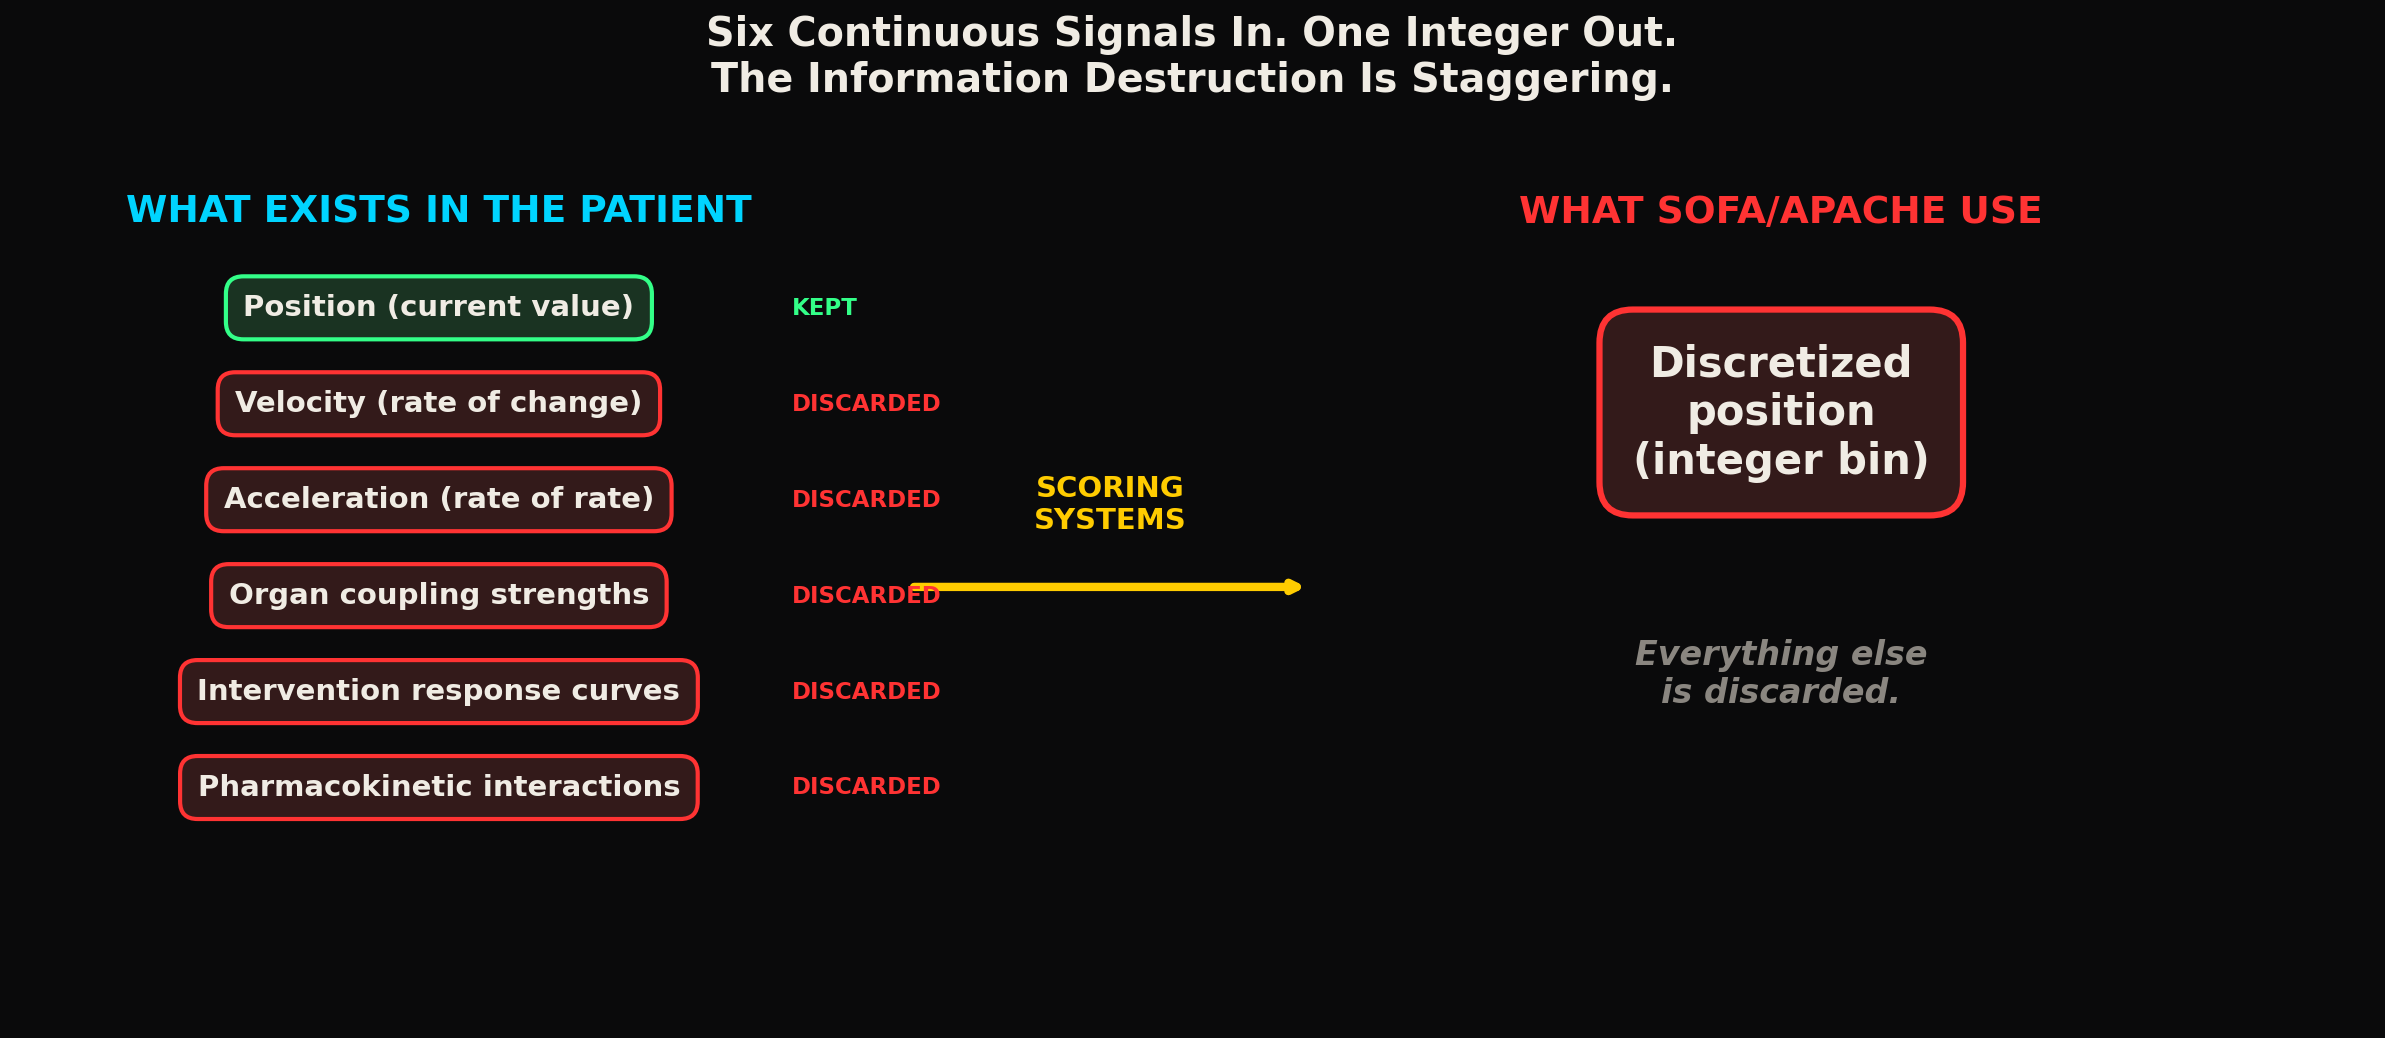
A SOFA score takes six organ systems, measures one or two parameters for each, discretizes the continuous value into an integer bin (0, 1, 2, 3, or 4), and sums them. A patient with a cardiovascular SOFA of 2 and a renal SOFA of 3 gets a combined score that tells you... what exactly? That the patient is sick. The patient is in your ICU. You already knew they were sick. The SOFA score added no information that the admitting diagnosis did not already provide.
What SOFA does not tell you: which organ system is deteriorating fastest. Whether the cardiovascular component is stable at 2 or was 0 yesterday and climbing. Whether the renal component peaked at 4 two days ago and is now recovering to 3, or whether it has been sitting at 3 for a week with zero change. The score collapses all of this temporal information into a single integer. The derivative is gone. The trajectory is gone. The clinical picture that would actually inform your next decision is gone.
And this is the score that multicenter trials use to stratify patients, that ICU guidelines reference for treatment escalation, and that insurance systems use to justify or deny critical care interventions.
APACHE II was published in 1985. SOFA in 1996. qSOFA in 2016. Three decades and the fundamental approach has not changed: take a continuous biological signal, chop it into bins, assign a number, sum the numbers, call it severity. Every one of these systems makes the same mistake. They treat organ function as a position measurement. They throw away the velocity. They throw away the acceleration. They throw away the coupling between organ systems. They give you a number that tells you where the patient is right now (roughly, with massive information loss from discretization) and nothing about where the patient is headed.
A speedometer that only shows your current position would be useless for driving. You would crash every time the road curves. This is what we built for ICU monitoring and called it state of the art.
2The vasopressor paradox
The velocity problem compounds in ways that most people do not think about.
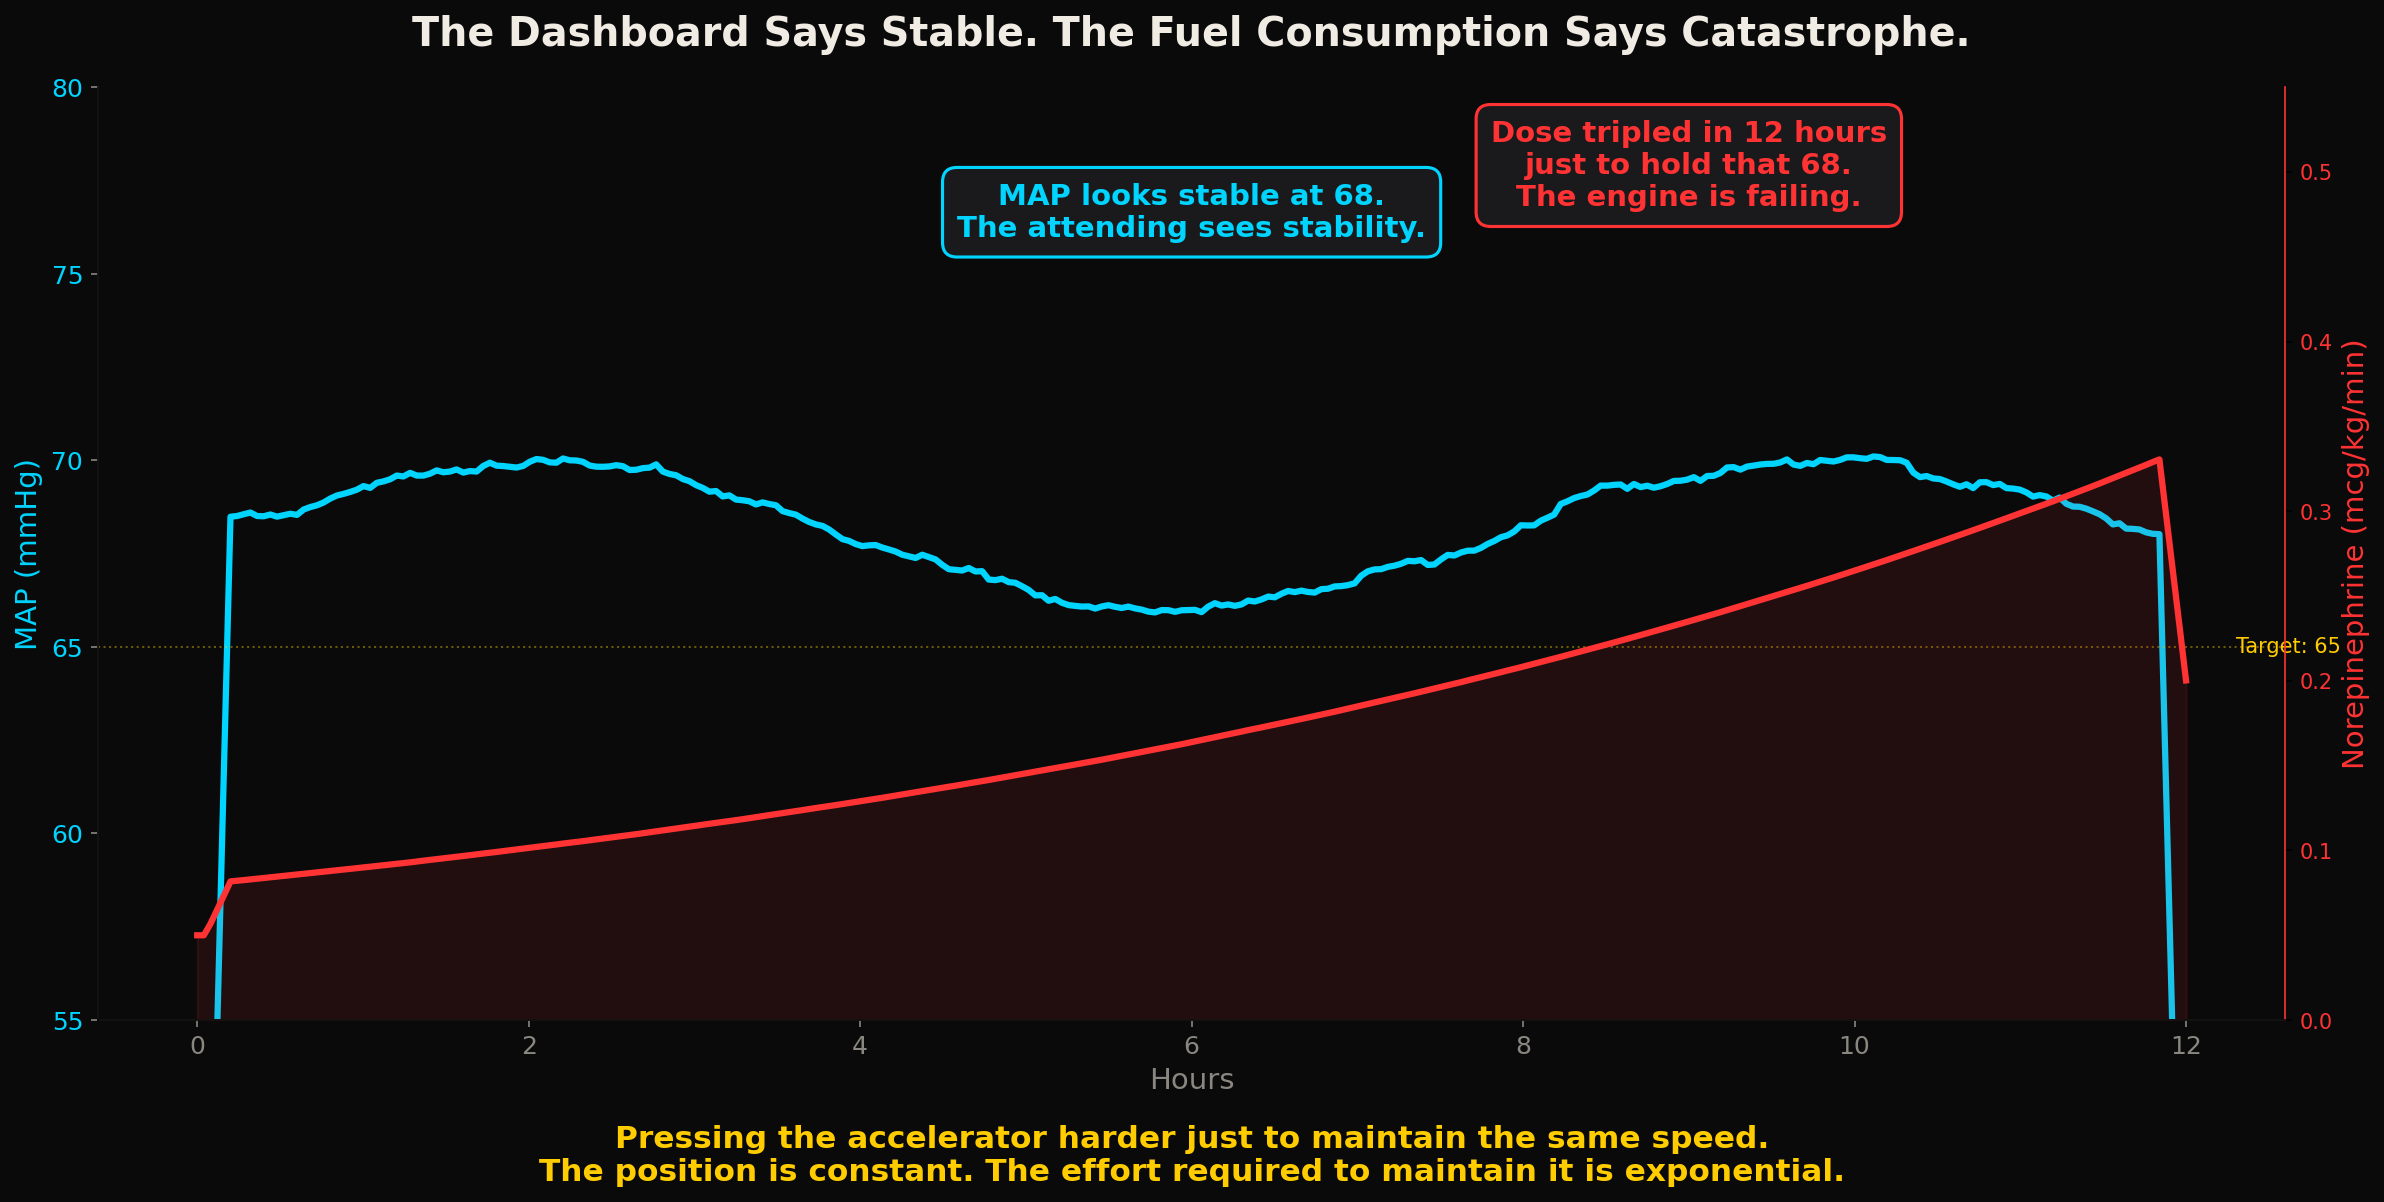
Consider a patient on vasopressors for septic shock. The mean arterial pressure is 68 mmHg. The attending looks at this number and decides: holding at target, maybe increase the dose slightly. MAP has been between 65 and 72 for the last several hours based on the nursing chart. Looks stable.
What the nursing chart does not capture is the vasopressor dose trajectory. The MAP is 68, yes. But the norepinephrine dose required to maintain that 68 has gone from 0.1 mcg/kg/min to 0.25 mcg/kg/min over the past 4 hours. The position (MAP) looks stable. The input required to maintain that position has more than doubled. This is the hemodynamic equivalent of pressing the accelerator harder and harder just to maintain the same speed. The engine is failing. The number on the dashboard says everything is fine. The fuel consumption says catastrophe is imminent.
The attending who only sees MAP = 68 makes a different decision from the attending who sees MAP = 68 AND vasopressor requirement doubling every 4 hours. The first one sees stability. The second one sees impending cardiovascular collapse. The data for the second interpretation exists in the infusion pump logs, in the medication administration record, in the charted dose changes. It is all there. Nobody fuses it into a trajectory representation that a clinician can actually read during a 2 minute assessment at the bedside.
3The discretization trap
The discretization problem is worth understanding precisely because it is so fundamental and so ignored.
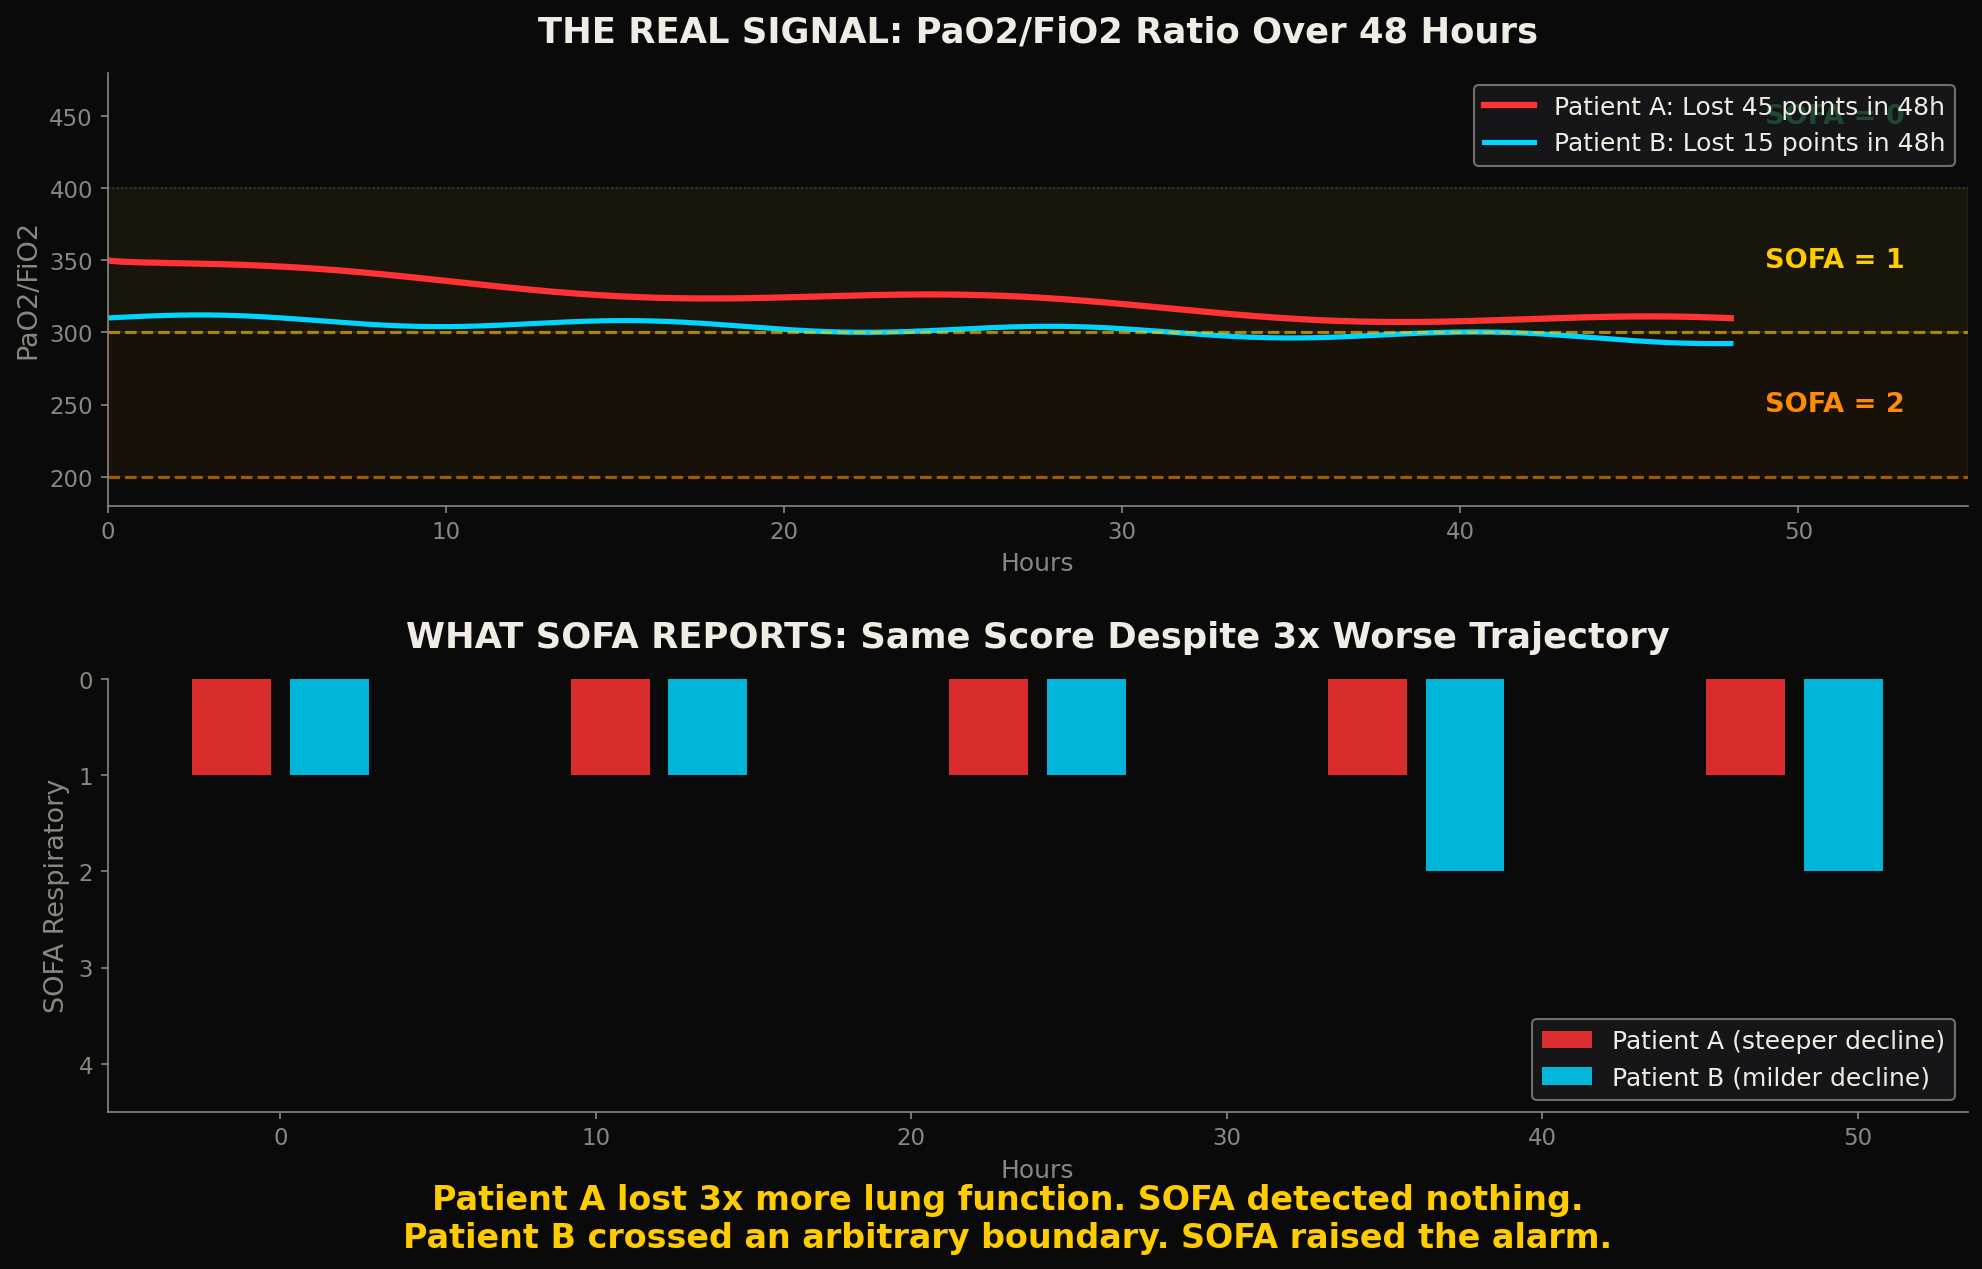
When SOFA converts a PaO2/FiO2 ratio into an integer (PaO2/FiO2 > 400 = 0, 300 to 399 = 1, 200 to 299 = 2, 100 to 199 = 3, < 100 = 4), it creates artificial boundaries that have no physiological basis. A patient at PaO2/FiO2 of 301 and a patient at PaO2/FiO2 of 399 get the same score: 1. The clinical difference between them is enormous. One is barely abnormal. The other is approaching the threshold for moderate ARDS. SOFA treats them identically.
A patient who drops from PaO2/FiO2 of 350 to 305 in 6 hours gets the same SOFA respiratory score both times: 1. No change detected. But that patient just lost 45 points of oxygenation capacity in 6 hours. The trajectory is screaming at you. The score is silent.
A patient who drops from 305 to 295 in the same 6 hours, a much smaller absolute change, triggers a SOFA increase from 1 to 2 because they crossed the 300 boundary. The scoring system says this patient got worse. The other patient, with a much steeper decline, shows no change at all. The arbitrary bin boundary creates false signals and hides real ones simultaneously.
Now multiply this across six organ systems, each with their own arbitrary boundaries, and sum them into a single number. The information destruction is staggering. You started with six continuous physiological signals, each with position, velocity, and acceleration. You ended with a single integer that cannot distinguish between a patient who is stable at moderate severity and a patient who is in free fall through the moderate range and will be in the severe range within hours.
Who decided where to put the bin boundaries? On what evidence? And why has nobody questioned whether discretizing continuous organ function into 5 levels is sufficient to capture the clinical state space of a critically ill patient?
4The language of position
There is a deeper problem that goes beyond individual scoring systems. The entire clinical mental model is built around values, not trajectories.
Lab reports present numbers. EMR dashboards display numbers. Alarm systems trigger on numbers crossing thresholds. Treatment protocols specify interventions based on numbers reaching certain levels. The language of clinical medicine is the language of position: creatinine IS 2.1, lactate IS 4.5, MAP IS 68, platelets ARE 45,000.
Nobody says: creatinine is MOVING at +0.3 per hour. Lactate VELOCITY just turned negative. MAP is BEING MAINTAINED by exponentially increasing vasopressor doses. Platelet TRAJECTORY predicts crossing 20,000 in the next 8 hours at current rate.
The trajectory information is available; the clinical infrastructure was simply never designed to compute, display or communicate it. The lab system reports a number. The EMR stores a number. The alarm triggers on a number. The consultant gets called with a number. At every step of the clinical information chain, the trajectory information is discarded and only the position remains.
The result is that the most data rich environment in medicine (the ICU, with its continuous vital sign streams, its frequent lab draws, its real time medication infusion rates) produces the most impoverished clinical representation: a list of numbers, each observed at a different time, each stripped of its trajectory context, each evaluated in isolation from the others.
5The coupling nobody computes
Think about what it means that an ICU patient has 20+ parameters being tracked simultaneously, and each one is evaluated independently against its own reference range.
Creatinine is evaluated by nephrology. Bilirubin by hepatology. Troponin by cardiology. PaO2 by pulmonology. Lactate by... everyone and no one. Each specialist looks at their organ system's numbers. Each one sees a position. Nobody sees the coupling.
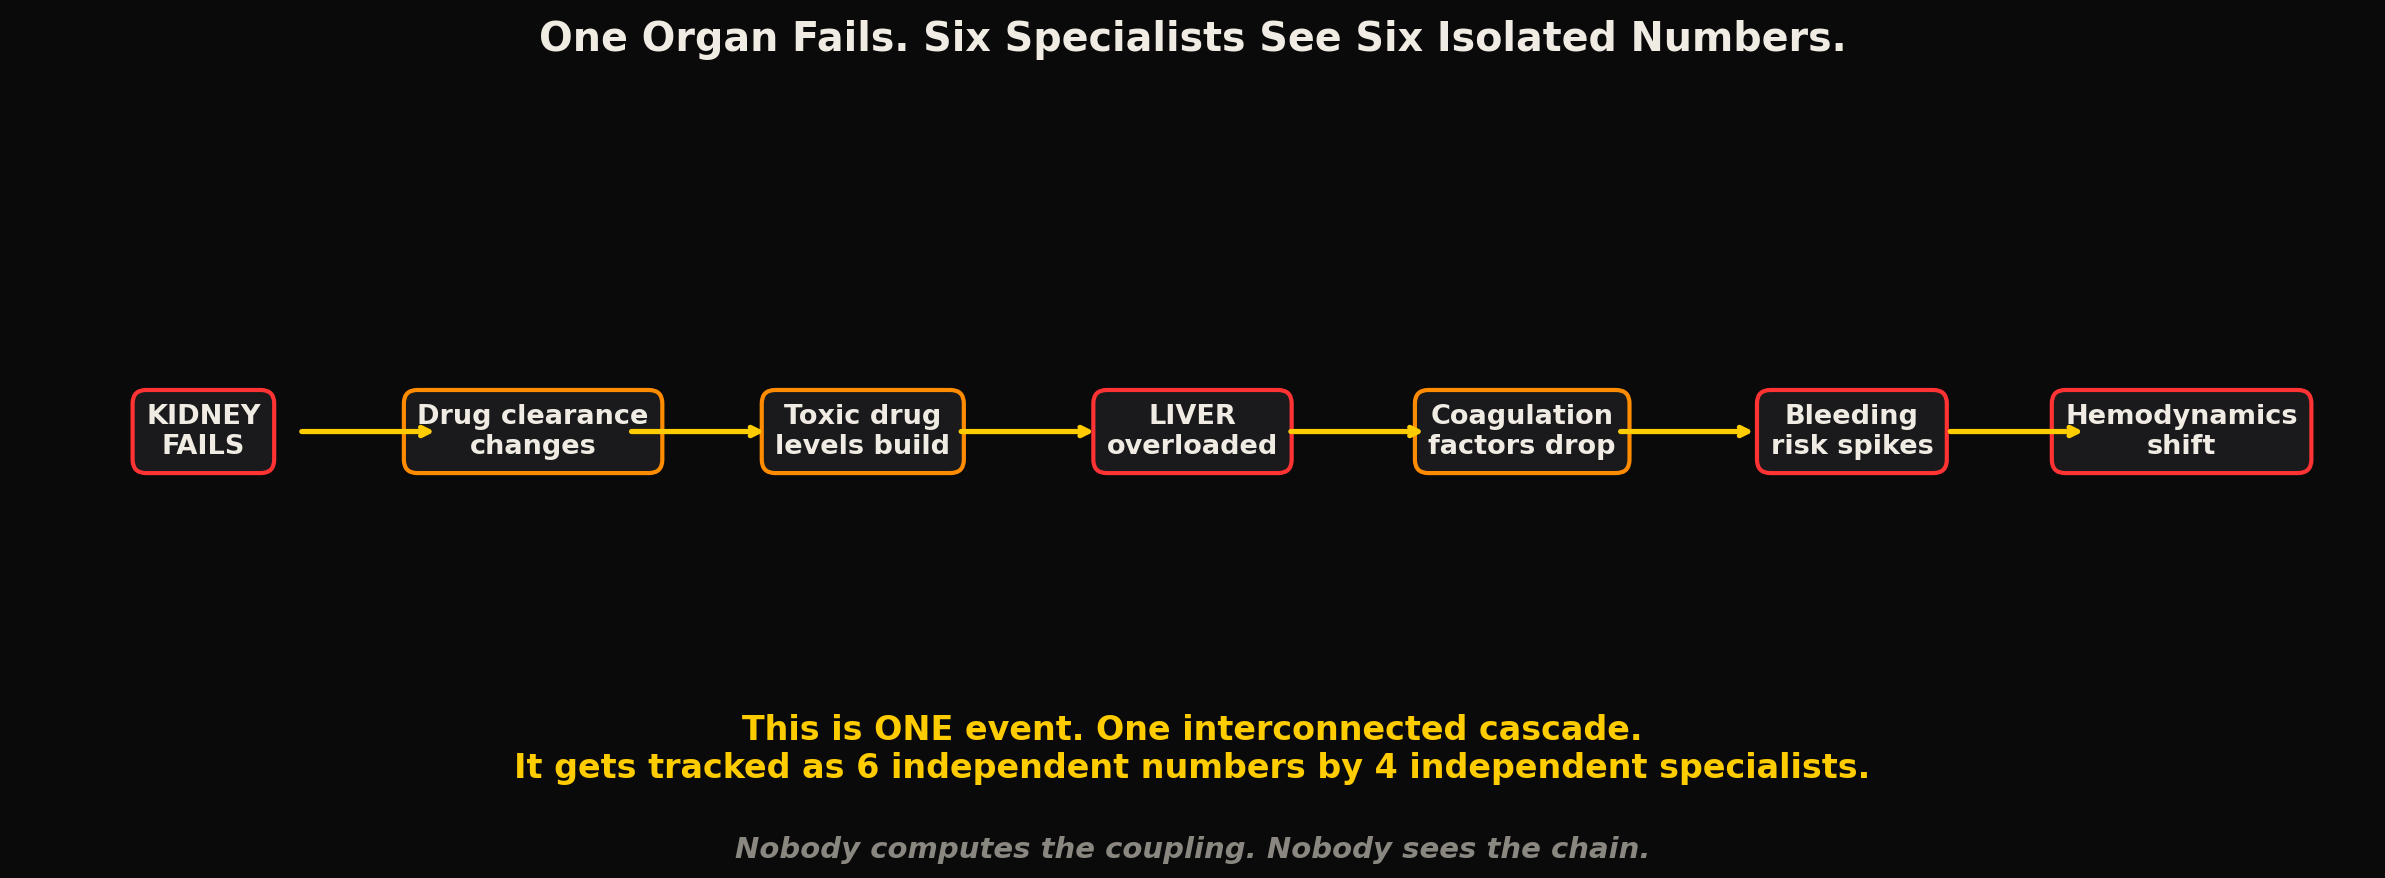
When kidney function degrades, the clearance of renally excreted drugs changes. This alters the effective dose of every medication the patient is on. Some drugs accumulate to toxic levels. Others fall below therapeutic thresholds. The hepatic system compensates initially, then gets overwhelmed. Coagulation factors that depend on hepatic synthesis start declining. Platelet consumption increases. The hematologic system destabilizes. Fluid shifts. Electrolytes shift. Cardiac preload changes. Hemodynamics shift.
This cascade is a single event. It is one interconnected system failing in a specific sequence with specific timing and specific coupling strengths between the components. It gets tracked as 12 independent numbers in 6 independent specialty consultations, each one responding to their own organ's values without computational awareness of the coupling dynamics that connect them all.
The intensivist sitting in the middle of this is supposed to be the integrator. They are supposed to see the big picture. But the big picture requires tracking 20+ parameters simultaneously, computing the derivative of each, estimating the cross coupling between them, and predicting forward trajectories for multiple organ systems under the influence of multiple concurrent interventions, each with different pharmacokinetic and pharmacodynamic profiles.
No human brain can do this with 15 patients, with lab values arriving at staggered times from a central lab that is 3 hours behind real time, on hour 14 of a 24 hour shift. It is a question of computational bandwidth, not of intelligence, training or dedication. The human brain was not designed to be a multivariate state estimator running 20 simultaneous trajectory models with cross coupling terms.
We pretend it is. We call it clinical judgment. And when it fails (when the trajectory was missed, when the coupling was not seen, when the intervention came 3 hours too late), we call it a complication. Or bad luck. Or disease progression.
It is the inevitable result of asking a human to do math that requires a machine.
6Garbage in, publication out
Every year, the critical care research community publishes hundreds of papers building new prediction models, new severity scores, new early warning systems. Almost all of them take the same approach: collect a set of features (lab values, vital signs, demographics), feed them into a statistical model or a neural network, and predict an outcome (mortality, sepsis onset, organ failure).
Almost all of them use the values, the numbers, the positions as inputs, and almost none of them use the trajectories: the velocities, the accelerations, the coupling strengths between organ systems, the rate of change of the rate of change, which is the information that actually determines what happens next.
The datasets they train on (MIMIC, eICU, institutional EHRs) contain lab values sampled every 12 to 24 hours. The models learn patterns from these snapshots. They learn that high lactate correlates with mortality. They learn that low platelets correlate with severity. They learn what any second year resident already knows from clinical experience: bad numbers mean sick patients. The model outputs a probability. The probability adds almost nothing that the clinician did not already intuit from looking at the same numbers.
The reason these models add so little value is that they are learning the wrong representation. They are learning the relationship between static positions and outcomes. They should be learning the relationship between trajectories and outcomes. A lactate of 4.0 with a velocity of +1.2/hour is a completely different clinical entity from a lactate of 4.0 with a velocity of negative 0.8/hour. They would get the same risk score from most prediction models. They require opposite clinical responses.
The training data itself does not contain the trajectory information at the temporal resolution needed to compute meaningful derivatives. The data was sampled at 12 to 24 hour intervals. The velocity between two points 24 hours apart is an average that hides everything interesting. The models are learning from data that was aliased at the point of collection, building predictions on artifacts, and publishing results that are mathematically guaranteed to miss the dynamics that determine outcomes.
Garbage in, publication out.
7The frame is wrong
The hardest part of this problem is conceptual, not technical.
The entire infrastructure of clinical medicine has been built around the idea that a measurement tells you about a patient, when it only tells you about a moment, and the patient is not a moment. The patient is a trajectory through a state space so complex that a single snapshot from any angle is guaranteed to be misleading.
The question is not "what is the creatinine." The question is "where is the kidney on its trajectory, how fast is it moving, in which direction, and will the intervention I am about to give reach the organ before it crosses the point of no return."
That question requires continuous state estimation. Continuous means at a temporal resolution sufficient to capture the fastest clinically relevant physiological transitions. State estimation means computing the full trajectory (position, velocity, acceleration) from noisy, unreliable, intermittent measurements. These are engineering problems with known mathematical solutions that have been deployed in aerospace, navigation, and industrial control for decades.
Medicine has not adopted them. The question is why.
The answer is neither complexity, since fighter jets tracking multiple targets in real time solve harder estimation problems than an ICU patient with 20 biomarkers, nor cost, since the computational hardware required fits on a single embedded board. The answer is that nobody framed ICU monitoring as a state estimation problem. It was framed as a threshold detection problem. And once you build your infrastructure around thresholds (alarms, scoring systems, protocols), every improvement is incremental within that frame.
The frame itself is wrong.
The trajectory is the patient, not the number on the screen. And until medicine starts treating it that way, every alarm will fire too late, every score will miss the dynamics, and every intervention will be timed by intuition when it could have been timed by computation.
Declarations
Competing interests. The author is the founder of Aethryva Deeptech, which develops the tachyDx platform and the MOISSCode language. Where an article in this series mentions either, it says so in the text and the mention follows the argument.
Sources and figures. This article argues from first principles and from the author's own published work, and carries no reference list. Figures are schematic. Articles in the series from April 2026 onward cite open access sources only.
Cite this article
Kunche N. The number on your screen means nothing. The Intervention. 7 March 2026. https://nikhilkunche.com/blog/the-number-on-your-screen-means-nothing
Comments