
A researcher downloads MIMIC-IV. Lactate, creatinine, bilirubin, platelets, vitals at admission. Standard features. They train an XGBoost model to predict ICU mortality. The AUC comes back at 0.82. The paper gets accepted. The model joins a leaderboard alongside a hundred others all doing the same thing with slight variations in architecture, feature selection, or preprocessing.
Nobody asks what the training data actually represents.
Not what the columns are labeled or what the documentation says the variables mean, but what the numbers in those columns physically correspond to in the real world. Because the answer to that question should stop every clinical AI researcher in their tracks.
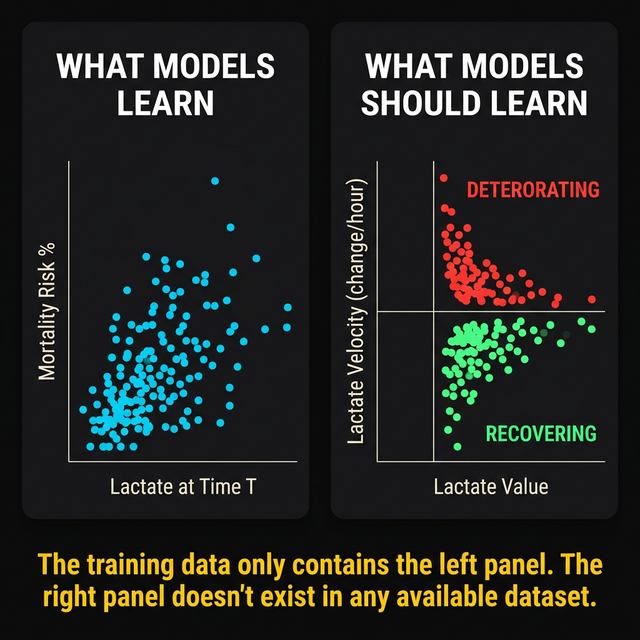
The training data is a collection of snapshots. Each row is a moment. A blood draw taken at some point during an ICU stay, processed through a lab, reported into the EHR, and timestamped. The model sees: lactate was 4.2 at this time. Creatinine was 2.1 at this time. Platelets were 68,000 at this time. It learns correlations between these snapshot values and outcomes. High lactate correlates with mortality. Rising creatinine correlates with organ failure. Falling platelets correlate with severity.
These correlations are real, and they are useless in the way that matters most.
1The aliasing callback
In the previous post in this series, we showed that ICU biochemical sampling violates the Nyquist-Shannon sampling theorem by 16x to 32x. The signal you reconstruct from these samples looks plausible. It is internally consistent. It is wrong.
The aliased signal is a smooth, believable version of reality that happens to be a mathematical fiction, not random noise or obvious garbage. You cannot detect the error from the samples alone because the aliased signal satisfies every consistency check you can run on it. The only way to know the reconstruction is wrong is to have the original continuous signal to compare against. And you do not have that. Nobody does.
Now apply this to training data.
Every row in MIMIC-IV, every row in eICU-CRD, every row in your institutional EHR extract is a sample from an aliased signal. The lactate trajectory between two measurements taken 12 hours apart was never recorded. The creatinine trajectory between two measurements taken 24 hours apart was never recorded. The model does not learn the relationship between the real physiological trajectory and the outcome. It learns the relationship between aliased snapshots and outcomes.
It learns the wrong function.
The model does not learn the relationship between the real physiological trajectory and the outcome. It learns the relationship between aliased snapshots and outcomes. It learns a hallucination.
This is the foundational problem with the entire field of clinical prediction modeling, not a subtle point or a caveat buried in the limitations section, and it has been hiding in every dataset, every benchmark, and every leaderboard for the past decade.
2The Epic sepsis model
If this were a theoretical concern it would be interesting but ignorable, and it is not theoretical. It has already played out at scale, in production, on real patients.
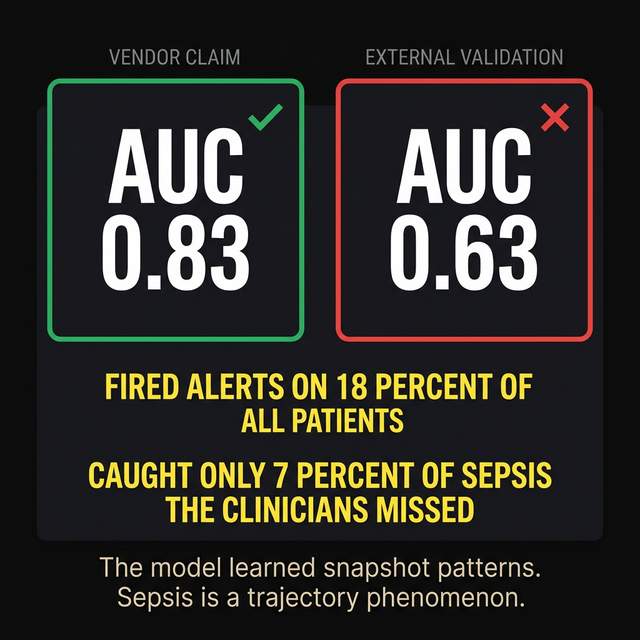
The Epic Sepsis Model was deployed across hundreds of hospitals. The vendor reported an AUC of 0.83 for predicting sepsis onset. External validation published in JAMA Internal Medicine found something different.
The AUC collapsed to 0.63. The model fired alerts on 18 percent of all hospitalized patients. Of all the sepsis cases that clinicians missed, the model caught seven percent. The alert fatigue was enormous. The clinical utility was near zero.
Why did it fail?
It learned snapshot patterns. It learned that certain combinations of static lab values and vital signs, measured at certain timepoints, correlated with eventual sepsis diagnosis in the training data. What it could not learn, because the information did not exist in the training data, was the trajectory signature of early sepsis. The subtle acceleration in inflammatory markers. The velocity change in lactate that precedes the obvious elevation by hours. The coupling between organ systems that signals a cascade before any single number crosses a threshold.
Sepsis is a trajectory phenomenon. It is a system of coupled physiological processes accelerating toward a tipping point. The tipping point is identifiable from the trajectory. It is invisible from any single snapshot. A model trained on snapshots will always fail at detecting trajectory phenomena. It is a limitation of the training data, not of the architecture.
3The missing feature
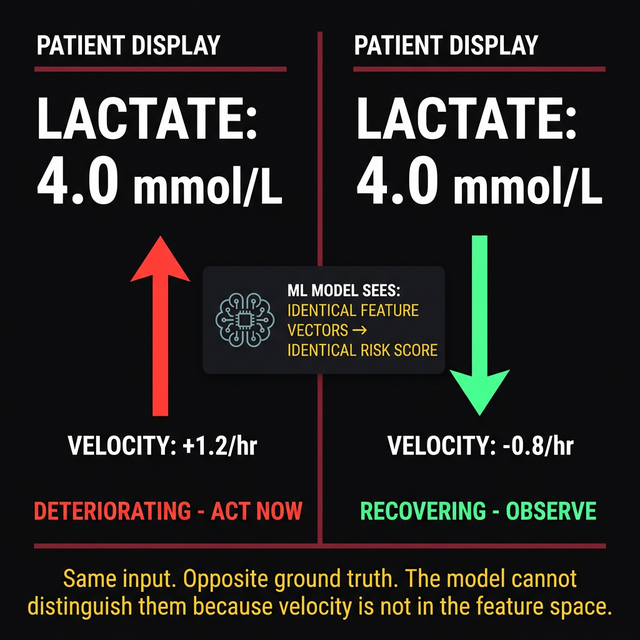
Consider two patients in your ICU right now. Both have a lactate of 4.0 mmol/L. In every prediction model trained on MIMIC, eICU, or any institutional dataset, they get the same feature value. The same input to the model. The same contribution to the risk score.
Patient A has a lactate velocity of +1.2 per hour. Four hours ago, the lactate was 2.0. It has been climbing steadily and is accelerating. This patient is deteriorating. The source of lactate production has not been controlled. The current value of 4.0 is a waypoint on a trajectory heading toward 8.0 or higher. This patient needs immediate source control, aggressive resuscitation, and possibly escalation of antibiotics.
Patient B has a lactate velocity of negative 0.8 per hour. Six hours ago, the lactate was 8.5. It has been falling steadily since the antibiotics started working. The current value of 4.0 is a recovery signal. The trajectory is heading toward normalization. This patient needs continued monitoring and patience. Intervention escalation would be unnecessary and potentially harmful.
The same lactate, the same feature vector and the same risk score from the model describe the opposite clinical reality and call for the opposite intervention.
The model cannot distinguish between these two patients because velocity is not in the feature space. It is not in the feature space because it is not in the training data. It is not in the training data because the sampling rate was too low to compute a meaningful velocity estimate.
No architectural innovation fixes this, whether deeper networks, attention mechanisms, transformers or foundation models. An incomplete feature space is an incomplete feature space regardless of the function approximator you use to learn from it. You cannot learn a function of variables that are not in your input.
4The derivative that cannot be computed
Someone will argue that you can compute velocity from the training data. Take two consecutive lab values, divide by the time interval, call it a rate of change. Include it as a feature. Problem solved.
It is not solved.
Computing the velocity from two points 24 hours apart gives you an average velocity over 24 hours. This average hides everything interesting. A lactate that rose from 2.0 to 6.0, peaked at 9.0, and fell back to 6.0 over 24 hours gives you the same average velocity as a lactate that rose steadily from 2.0 to 6.0 over 24 hours. The first patient had a crisis and partial recovery. The second patient had a slow deterioration. The average velocity is identical. The clinical trajectories are completely different.
Computing acceleration is worse. The second derivative of a signal sampled at 2 points is mathematically undefined. You cannot compute acceleration from two measurements. You need at minimum three measurements to estimate acceleration, and even then the estimate is an average over the time interval that may bear no relationship to the instantaneous acceleration at any point between the samples.
For a signal that changes on timescales of 60 to 90 minutes (which is the reality for acute organ failure transitions in the ICU), measurements taken 12 to 24 hours apart provide zero information about the derivative structure. The velocity you compute is an artifact and the acceleration is undefined. You are adding computed features that contain no physiological information and calling it feature engineering.
5The leaderboard problem
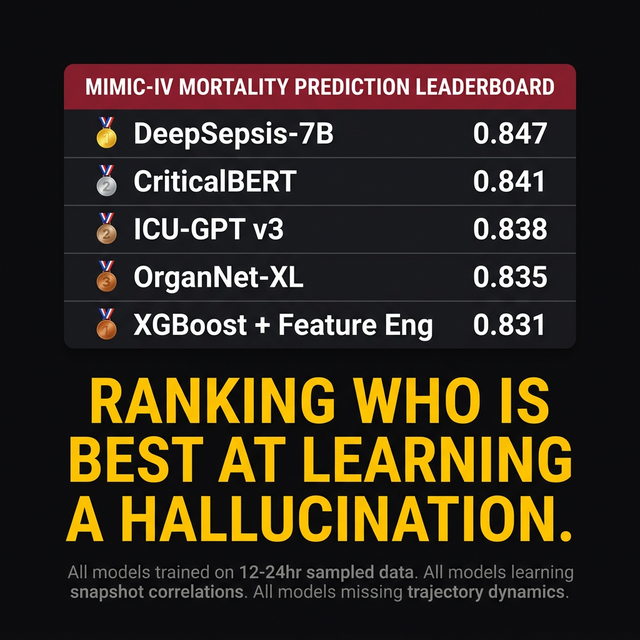
Clinical AI conferences and journals maintain informal leaderboards. Model X achieves AUC 0.85 on MIMIC-IV mortality prediction. Model Y achieves 0.87 with a novel architecture. Model Z achieves 0.88 with multimodal feature fusion. Each incremental improvement gets published. Each publication cites the previous record holders. Each lab group competes to push the number higher.
What is this leaderboard actually measuring?
It is measuring which model is best at learning correlations between aliased snapshots and outcomes. The snapshots are sampled at 12 to 24 hour intervals. The physiological dynamics that determine outcomes occur at 60 to 90 minute timescales. The leaderboard is a competition for who can extract the most signal from a fundamentally impoverished representation of clinical reality.
The difference between AUC 0.82 and AUC 0.88 on snapshot data is not clinically meaningful. Both models miss the same trajectory phenomena. Both models fail on the same patient types: the ones where the outcome depends on dynamics that occurred between measurements. The incremental improvements represent better fitting of the noise floor of snapshot correlations, not better capture of the physiological signals that determine outcomes.
The entire field is optimizing the wrong loss function. The loss function should measure how well the model predicts trajectory-level outcomes from trajectory-level inputs. Instead, it measures how well the model predicts outcomes from snapshots. The global optimum on the snapshot loss surface is not the global optimum on the trajectory loss surface. They are fundamentally different optimization problems with fundamentally different solutions.
6What this means
The uncomfortable conclusion is that the problem sits upstream of models that are, in many cases, technically excellent: the feature engineering is thoughtful, the architectures are sophisticated, the validation methodology is rigorous, and the researchers building them are talented and well-intentioned. The problem is the data.
The data contains positions without velocities. Snapshots without trajectories. Static measurements of a dynamic system taken at intervals that violate the most basic theorem in signal processing by more than an order of magnitude. No model, regardless of architecture, can learn trajectory dynamics from data that does not contain trajectory information. The information was lost at the point of collection. It never entered the dataset. It cannot be recovered through cleverer algorithms.
The field needs trajectory-level data before model architecture matters. Biomarker values sampled at the temporal resolution sufficient to compute meaningful derivatives. Velocity and acceleration as first-class features, not as noisy post-hoc approximations from 24 hour intervals. Cross-biomarker coupling dynamics captured at timescales where the coupling is measurable.
No publicly available dataset currently contains this. Not MIMIC. Not eICU-CRD. Not any institutional EHR extract. The data infrastructure to generate trajectory-level training data does not exist in clinical practice anywhere in the world.
This means that every benchmark, every leaderboard, every published AUC is a measurement of how well models learn from a hallucination. The hallucination is not fabricated. It was measured. It was recorded. It was timestamped. It was stored in a database. It was cleaned and released to the research community.
It is still a hallucination, the aliased reconstruction of a signal that was never observed at the resolution needed to represent the underlying physiology, internally consistent and externally wrong.
The models are wrong because the data is wrong, not because the architecture is wrong. Garbage in, publication out.
Until the sampling problem is solved, no amount of architectural innovation, no amount of data cleaning, no amount of benchmark competition will produce models that capture the trajectory dynamics that determine whether a patient in the ICU lives or dies.
The training data needs to change first. Everything else is optimizing a hallucination.
Declarations
Competing interests. The author is the founder of Aethryva Deeptech, which develops the tachyDx platform and the MOISSCode language. Where an article in this series mentions either, it says so in the text and the mention follows the argument.
Sources and figures. This article argues from first principles and from the author's own published work, and carries no reference list. Figures are schematic. Articles in the series from April 2026 onward cite open access sources only.
Cite this article
Kunche N. Every clinical AI model is training on hallucinated data. The Intervention. 8 March 2026. https://nikhilkunche.com/blog/every-clinical-ai-model-is-training-on-hallucinated-data
Comments