
It is day six of a septic admission. The cultures have grown, the antibiotics are right, the pressors are coming down, and the morning haemoglobin is 9.1. It was 10.2 on day three. The resident has already looked for the bleed: the drain is dry, the stool is negative, the abdomen is soft, the coagulation profile is normal. The team cannot find where the blood went, so it writes the number down as anaemia of critical illness and moves on. If it drops below 7 somebody will hang a unit.
The answer is on the nursing flow sheet, in the column that never gets added up. Blood gases at 2 AM, 6 AM, 2 PM and 10 PM, a full count, a renal panel and a liver panel at 6 AM, two sets of cultures on day four, a coagulation screen before the line change, and before every one of those draws a syringe of blood pulled off the arterial line and thrown away so the sample would not be diluted by the flush.
You have signed for that unit of blood. You have probably pulled the discard syringe yourself on a night shift, without thinking about where the volume was going, because the protocol said to clear the line and the protocol was right about the dilution. What the protocol never said is what the clearing adds up to over a fortnight.
The patient has been bleeding since admission. The bleed is the monitoring.
1How much is actually leaving
The figure that matters is the daily one, and it is larger than most people on the unit would guess. In a Toronto cohort of 428 ICU admissions, the mean phlebotomy volume was 48.1 mL per patient per day, and a bedside audit found that 15.0 mL of that was discarded as waste before the sample was even taken1. A scoping review of 38 adult ICU studies put the published range of daily diagnostic blood loss at up to 377 mL per patient per day2. Even in long stay patients, whose testing has settled into a quieter rhythm, the daily volume runs at 13.3 mL3. In that cohort an extra 3.5 mL a day was enough to double the odds of transfusion after the third week. Put that number against your own unit. Count the draws on one flow sheet, add the discard in front of each, and you will have your own daily figure before the round starts.
Now convert millilitres to haemoglobin. The conversion is roughly linear. In 404 general medical admissions, every 100 mL drawn for testing was associated with a fall of 7 g/L in haemoglobin4. Those were ward patients with working bone marrow. A septic patient in an ICU is making fewer red cells while losing more blood, so basically the ward conversion is a floor. A floor is enough to do the arithmetic for a fortnight.
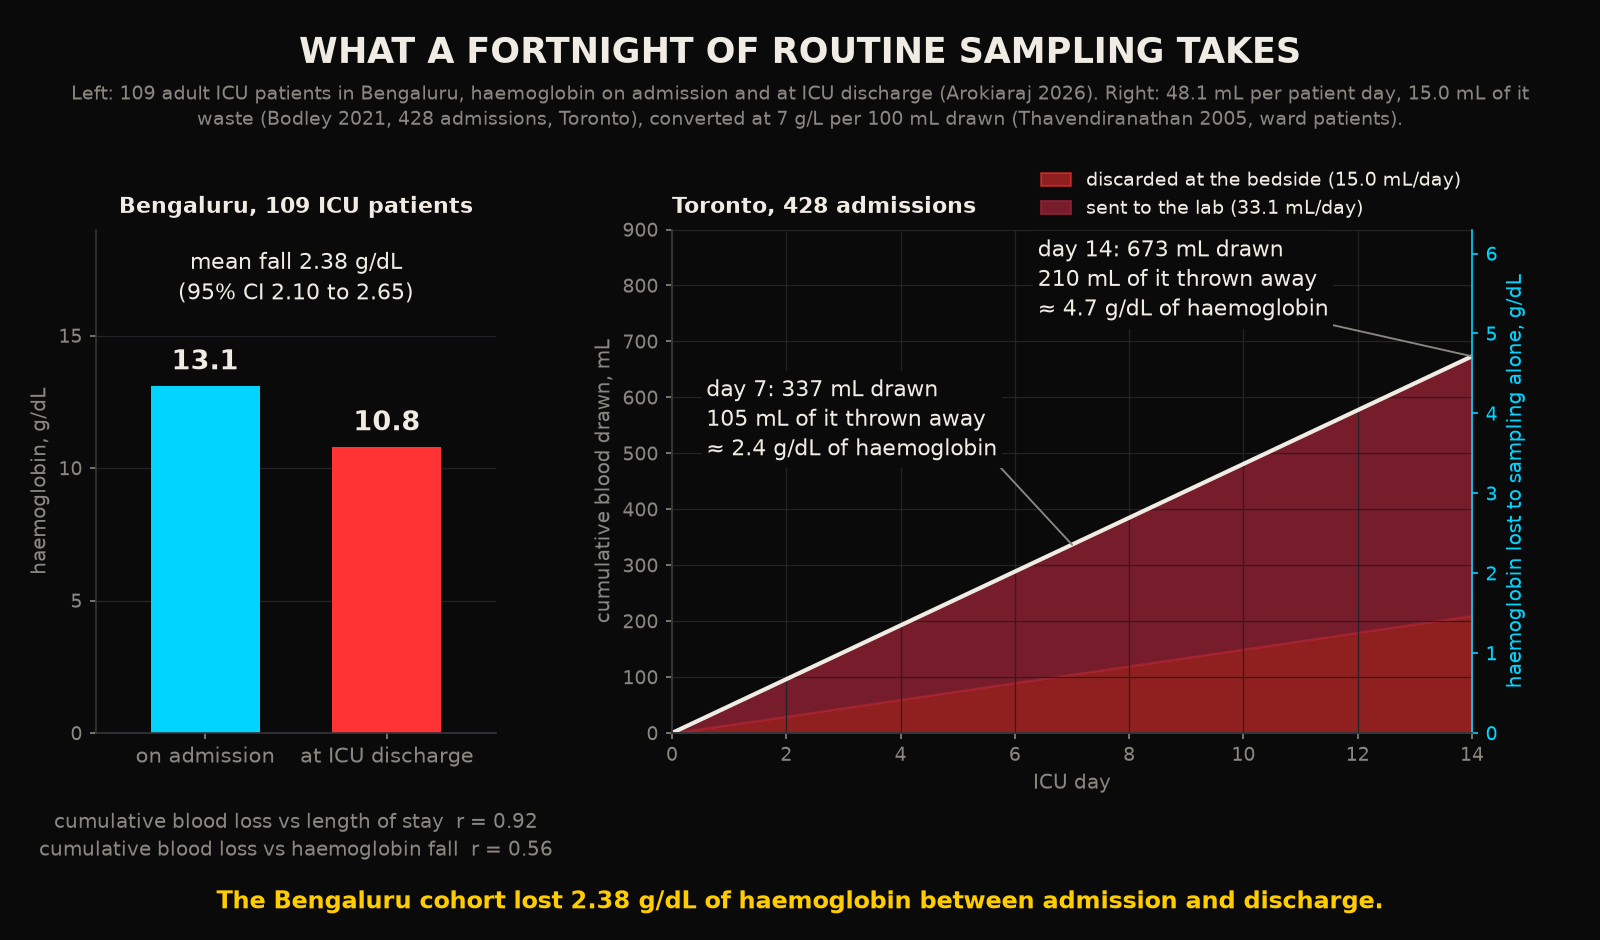
Those are the numbers behind the sentence that opens most reviews of this subject: as many as 90 percent of patients are anaemic by their third day in an ICU5. The sickest patients are tested the most, stay the longest, and regenerate the least. They are also the ones in whom a unit of blood carries the most risk. The dose response is in the Toronto data. Every additional 5 mL per day of phlebotomy raised the odds of a nadir haemoglobin under 80 g/L by 18 percent and the odds of transfusion by 17 percent1.
India has no multicentre cohort on this yet. A single centre audit of 109 adult ICU patients at a Bengaluru teaching hospital found haemoglobin falling from 13.1 g/dL on admission to 10.8 at discharge, with the cumulative sampling volume tracking the length of stay at a correlation of 0.926. Over half of those patients were anaemic by the time they left. That is the Toronto curve, on a population that arrives with less reserve. One qualification is owed here: Toronto is one centre and Bengaluru is one hospital, and neither number is a national rate.
2Where the blood goes
The natural assumption is that the assay needs the blood. It needs almost none of it. When the College of American Pathologists surveyed 140 laboratories on how much they collected against how much their instruments consumed, the median laboratory was drawing 8.5 times the analytic volume for a full blood count and about 12 times the analytic volume for an electrolyte panel7. It was discarding 2.8 mL and 2.0 mL per tube respectively. The instrument aspirates a few hundred microlitres. The tube holds millilitres because it was designed for a different era of analysers (the analysers moved on, the glassware did not). It was never redesigned.
Then there is the line. To draw from an arterial catheter you first pull back the flush solution and the diluted blood sitting in the dead space. That volume goes in the bin. In the Toronto audit it came to 3.9 mL per arterial draw, 5.5 mL from a central line and 6.3 mL from a PICC1. Put the two together for a single full count from an arterial line and the anatomy of a draw looks like this.
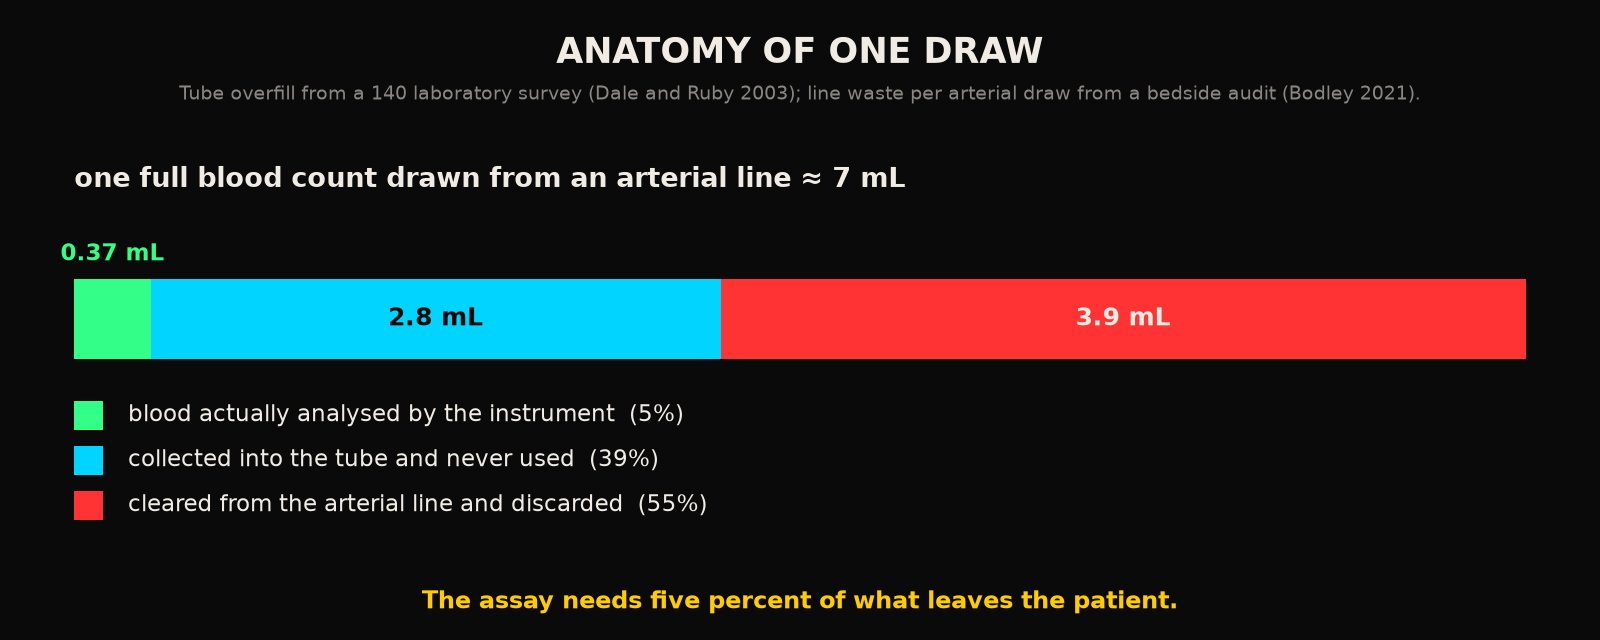
Five percent of what leaves the patient is measurement. The other 95 percent is packaging. The packaging is what is making the patient anaemic. Think of it as posting a pill in a shoebox: the thing you need is tiny and the box is what costs you. This is worth sitting with, because it changes what kind of problem this is. If the assay needed the blood, then sampling rate and blood loss would be locked together, and the argument of the previous post, that fast analytes need fast sampling, would run straight into a wall. They are only bundled together by a tube size and a line protocol.
3Why transfusion is not the answer
The unit's reflex, when the haemoglobin finally crosses the line, is to replace what was taken. That reflex has been tested. Across 48 trials and 21,433 participants, restrictive transfusion thresholds of 7 to 8 g/dL cut the number of patients exposed to a transfusion by 41 percent with no difference in 30 day mortality against liberal thresholds8. This is exactly why the Choosing Wisely list for critical care tells you to leave a stable, non bleeding ICU patient alone above 7 g/dL9. A unit of blood is an intervention with its own risks, given here to replace a loss that the unit itself inflicted.
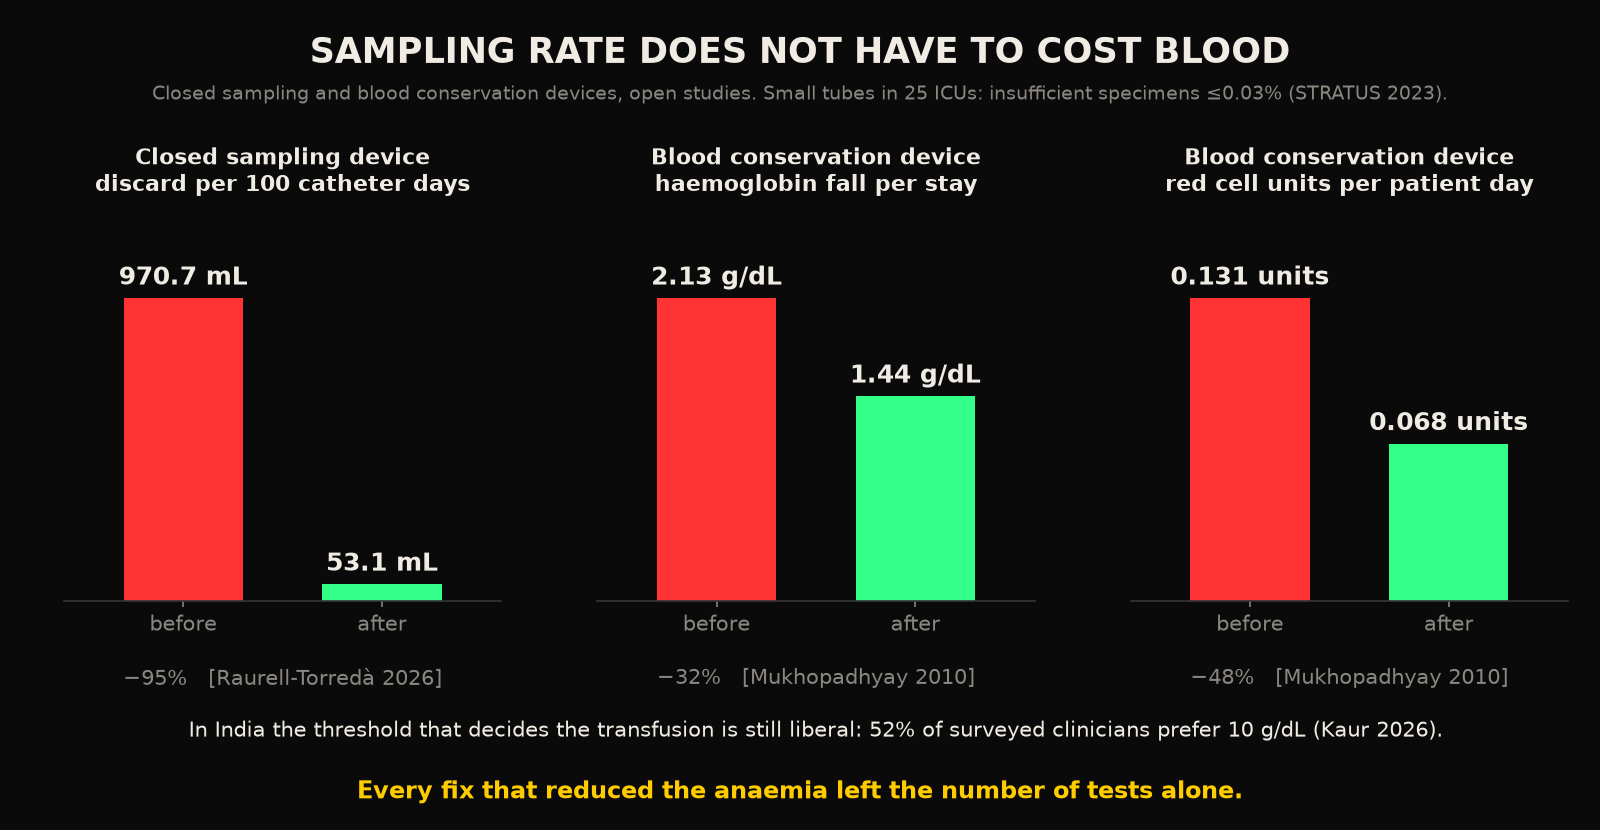
In India the reflex is stronger. A national survey of transfusion practice found that 52 percent of respondents still preferred a liberal threshold of 10 g/dL10. Picture a unit running that threshold. The sampling takes the haemoglobin down, the protocol puts it back with donor blood, and the whole cycle stays invisible because the volume that caused it was never totalled. What I mean by that is the unit is treating a number it produced. Who is that donor blood actually treating, the patient or the phlebotomy roster?
4What happens when you stop throwing it away
None of this requires testing less. That matters, because the reflex of every audit is to order fewer tests, and the fast analytes of the previous post cannot afford fewer. The interventions that work leave the test count alone and attack the packaging. A closed sampling device returns the line clearance to the patient and the bin gets nothing. In a recent feasibility trial, discard volume fell from 970.7 to 53.1 mL per 100 catheter days and transfusions per 100 catheter days fell from 15.6 to 5.211. A blood conservation device in a Singapore ICU cut the fall in haemoglobin over the stay from 2.13 to 1.44 g/dL and halved red cell units per patient day12. Across the systematic review, interventions of this kind reduced blood loss by about a quarter5.
The most important result is the dullest. When 25 Canadian ICUs switched to small volume collection tubes in a stepped wedge trial of 27,411 patients, the proportion of specimens too small to analyse stayed at or below 0.03 percent before and after the switch13. Red cell units per patient fell modestly, with a relative risk of 0.88 in the full analysis and a primary analysis that did not reach significance. Read that honestly. The tubes were made smaller, the laboratory did not notice, and the patients needed slightly less blood. The volume was never needed.
5The constraint this sets
The previous post argued that glucose, potassium and lactate need sampling every hour or two. A daily panel is aliasing them. The obvious objection is the one this post started with. The patients who need the fast sampling are septic, anaemic, and already being bled by the monitoring. If sampling faster means drawing more, the cure reproduces the disease.
So the constraint for any measurement layer that wants to run at the speed of the physiology is this: sampling rate has to be decoupled from blood consumption. Faster must never mean more blood. The good part is that the decoupling is already physically available, because the assay needs microlitres and always did. What consumes the blood is the tube, the discard and the dead space. The gap is in the plumbing (a tube, a syringe and a few centimetres of line). Plumbing is the cheapest thing in the building to change, and every piece of it was an engineering decision, which means it can be unmade. A system that draws a few hundred microlitres per measurement, returns its line clearance, and never fills a 5 mL tube can sample every hour and take less blood in a day than the current panel takes in a morning.
Any architecture that buys time resolution with blood has simply reproduced the original problem in a more expensive package. That is the design test. It is a stricter one than accuracy.
Back on day six, the resident is still looking for a bleed that is not there. The flow sheet has the answer. The hospital has been measuring the patient with a method that is slowly making the patient worse, and it has been calling the result a baseline.
RReferences
- 1.Bodley T, Chan M, Levi O, et al. Patient harm associated with serial phlebotomy and blood waste in the intensive care unit: a retrospective cohort study. PLoS One. 2021;16(1):e0243782.
- 2.Helmer P, Hottenrott S, Steinisch A, et al. Avoidable blood loss in critical care and patient blood management: scoping review of diagnostic blood loss. J Clin Med. 2022;11(2):320.
- 3.Chant C, Wilson G, Friedrich JO. Anemia, transfusion, and phlebotomy practices in critically ill patients with prolonged ICU length of stay: a cohort study. Crit Care. 2006;10(5):R140.
- 4.Thavendiranathan P, Bagai A, Ebidia A, Detsky AS, Choudhry NK. Do blood tests cause anemia in hospitalized patients? The effect of diagnostic phlebotomy on hemoglobin and hematocrit levels. J Gen Intern Med. 2005;20(6):520-524.
- 5.Whitehead NS, Williams LO, Meleth S, et al. Interventions to prevent iatrogenic anemia: a Laboratory Medicine Best Practices systematic review. Crit Care. 2019;23(1):278.
- 6.Arokiaraj H, Krishnakumar M, Amalan J, et al. Routine blood sampling and hidden blood loss in ICU patients. Nurs Crit Care. 2026;31(5):e70680.
- 7.Dale JC, Ruby SG. Specimen collection volumes for laboratory tests. Arch Pathol Lab Med. 2003;127(2):162-168.
- 8.Carson JL, Stanworth SJ, Dennis JA, et al. Transfusion thresholds for guiding red blood cell transfusion. Cochrane Database Syst Rev. 2021;12:CD002042.
- 9.Halpern SD, Becker D, Curtis JR, et al. An official ATS/AACN/ACCP/SCCM policy statement: the Choosing Wisely top 5 list in critical care medicine. Am J Respir Crit Care Med. 2014;190(7):818-826. Official PDF.
- 10.Kaur D, Lamba DS, Singh B, et al. Knowledge, attitude, and practice survey for patient blood management in India. Asian J Transfus Sci. 2026;20(1):132-140.
- 11.Raurell-Torredà M, et al. Effectiveness of closed blood-sampling devices in critically ill adults: a feasibility trial. Nurs Crit Care. 2026;31(1):e70343.
- 12.Mukhopadhyay A, Yip HS, Prabhuswamy D, et al. The use of a blood conservation device to reduce red blood cell transfusion requirements: a before and after study. Crit Care. 2010;14(1):R7.
- 13.Siegal DM, Belley-Côté EP, Lee SF, et al. Small-volume blood collection tubes to reduce transfusions in intensive care: the STRATUS randomized clinical trial. JAMA. 2023;330(19):1872-1881. Full text in PMC.
Declarations
Competing interests. The author is the founder of Aethryva Deeptech, which develops the tachyDx platform and the MOISSCode language. Where an article in this series mentions either, it says so in the text and the mention follows the argument.
Sources and figures. Every reference in this article is an open access source that any reader can open without payment. The figures were drawn by the author from the values printed in those sources, or are labelled as schematic where no published value exists. No patient data were used.
Cite this article
Kunche N. Diagnostic blood loss is highest in the patients who can least afford it. The Intervention. 24 April 2026. https://nikhilkunche.com/blog/diagnostic-blood-loss-is-highest-in-the-patients-who-can-least-afford-it
Comments