
It is 2 AM on a surgical ward in Hyderabad and the registrar is doing exactly what the protocol says. The patient came out of theatre eight hours ago with a glucose of 14, so an insulin infusion is running, and a nurse is pricking a finger every hour and writing the number on a chart taped to the bed. That is diligent. It also happens to be right. The Society of Critical Care Medicine's insulin infusion guideline wants glucose checked every one to two hours on an infusion, hourly if the patient is unstable1. The 2024 update prefers an hour or less whenever the glucose is moving2.
On the same patient, in the same hour, the morning panel is already ordered. It will go at 6 AM with the phlebotomy round. It will carry a bilirubin that has not moved in three days and a potassium that may have moved a great deal in the last sixty minutes, because insulin pushes potassium into cells and the hourly list does not include potassium. You have seen this chart on your own ward. The glucose is hourly because somebody once wrote a glucose protocol. Everything else is daily because that is when the phlebotomist comes.
Neither interval was derived from the physiology of the analyte. One of them happens to match it. The rest of the panel is being drawn on a clock that belongs to the building.
1Eight clocks in one tube
A blood sample is one moment, and the lab reports it as one row of numbers. Nothing on the report says how fast each of those numbers is able to change. Each analyte has its own time constant. Line those constants up against the one timetable that samples them and the mismatch is large.
Glucose on an insulin drip is the fastest clock on the panel. It is also the only one the ward already treats as fast. NICE-SUGAR put 6,104 ICU patients on intensive or conventional glucose control and found severe hypoglycaemia in 6.8 percent of the intensive group against 0.5 percent of the conventional group, with higher mortality in the intensive arm3. That is what you get when you push a fast variable hard through a slow feedback loop. The swings themselves carry risk. In 44,964 ICU patients across nine countries, glycaemic variability above 20 percent was independently associated with death in patients without diabetes4. In 66,184 Australian and New Zealand admissions, variability within the first day carried an adjusted odds ratio of 1.5 for ICU mortality5. A once daily glucose cannot see variability at all. It sees one point on a curve that is swinging several times between draws.
Potassium looks like a slow analyte and gets treated as one. It sits on the daily panel. The problem is the insulin. A systematic review of insulin for hyperkalaemia found that a standard dose drops serum potassium by about 0.8 mmol/L within sixty minutes6. That same insulin is running, in that same patient, on the hourly glucose protocol above. So the potassium is changing on the glucose's clock. The chart is sampling it on the bilirubin's.
Troponin is the analyte where medicine has already conceded the point. The European Society of Cardiology's 2020 guideline recommends the 0 hour and 1 hour algorithm as the best option for ruling myocardial infarction in or out, with a 0 and 3 hour algorithm as the fallback7. Cardiology built a protocol on a one hour clock because the kinetics of the marker demanded one. The rest of the panel never got that treatment.
Lactate in septic shock sits in the middle. A systematic review of 96 studies concluded that the changes are relatively slow and that measurements every one to two hours are probably sufficient in most acute conditions8. Six hours is already enough to separate the living from the dead. In a French surgical ICU, lactate clearance over the first six hours was plus 13 percent in survivors and minus 13 percent in non survivors9. In the same cohort the 24 hour clearance was the best single predictor of death at 28 days. The Surviving Sepsis Campaign bundle says to remeasure lactate if the first value is above 2 mmol/L10. The 2021 guideline suggests serial lactate to guide resuscitation11. Serial, in a unit running a daily panel, means tomorrow.
Ammonia in acute liver failure is a decision variable with a hard threshold. In 80 consecutive patients at AIIMS, an arterial ammonia of 124 µmol/L or above predicted death with 79 percent sensitivity and 76 percent specificity, and non survivors ran a median of 175 against 105 in survivors12. The European liver guideline tells you to consider intracranial pressure monitoring when an ammonia above 150 to 200 is failing to fall with treatment13. Failing to fall is a statement about a trajectory. A trajectory needs more than one point a day before it exists.
Procalcitonin is the honest slow one. It lags the onset of sepsis by two to four hours, peaks at 24 to 48 hours, and clears with a half life of roughly a day to a day and a half14. Sampling it hourly would be waste. Sampling it daily is about right. Bilirubin is slower still and moves over days (this is textbook physiology and I am not going to dress it in a citation).
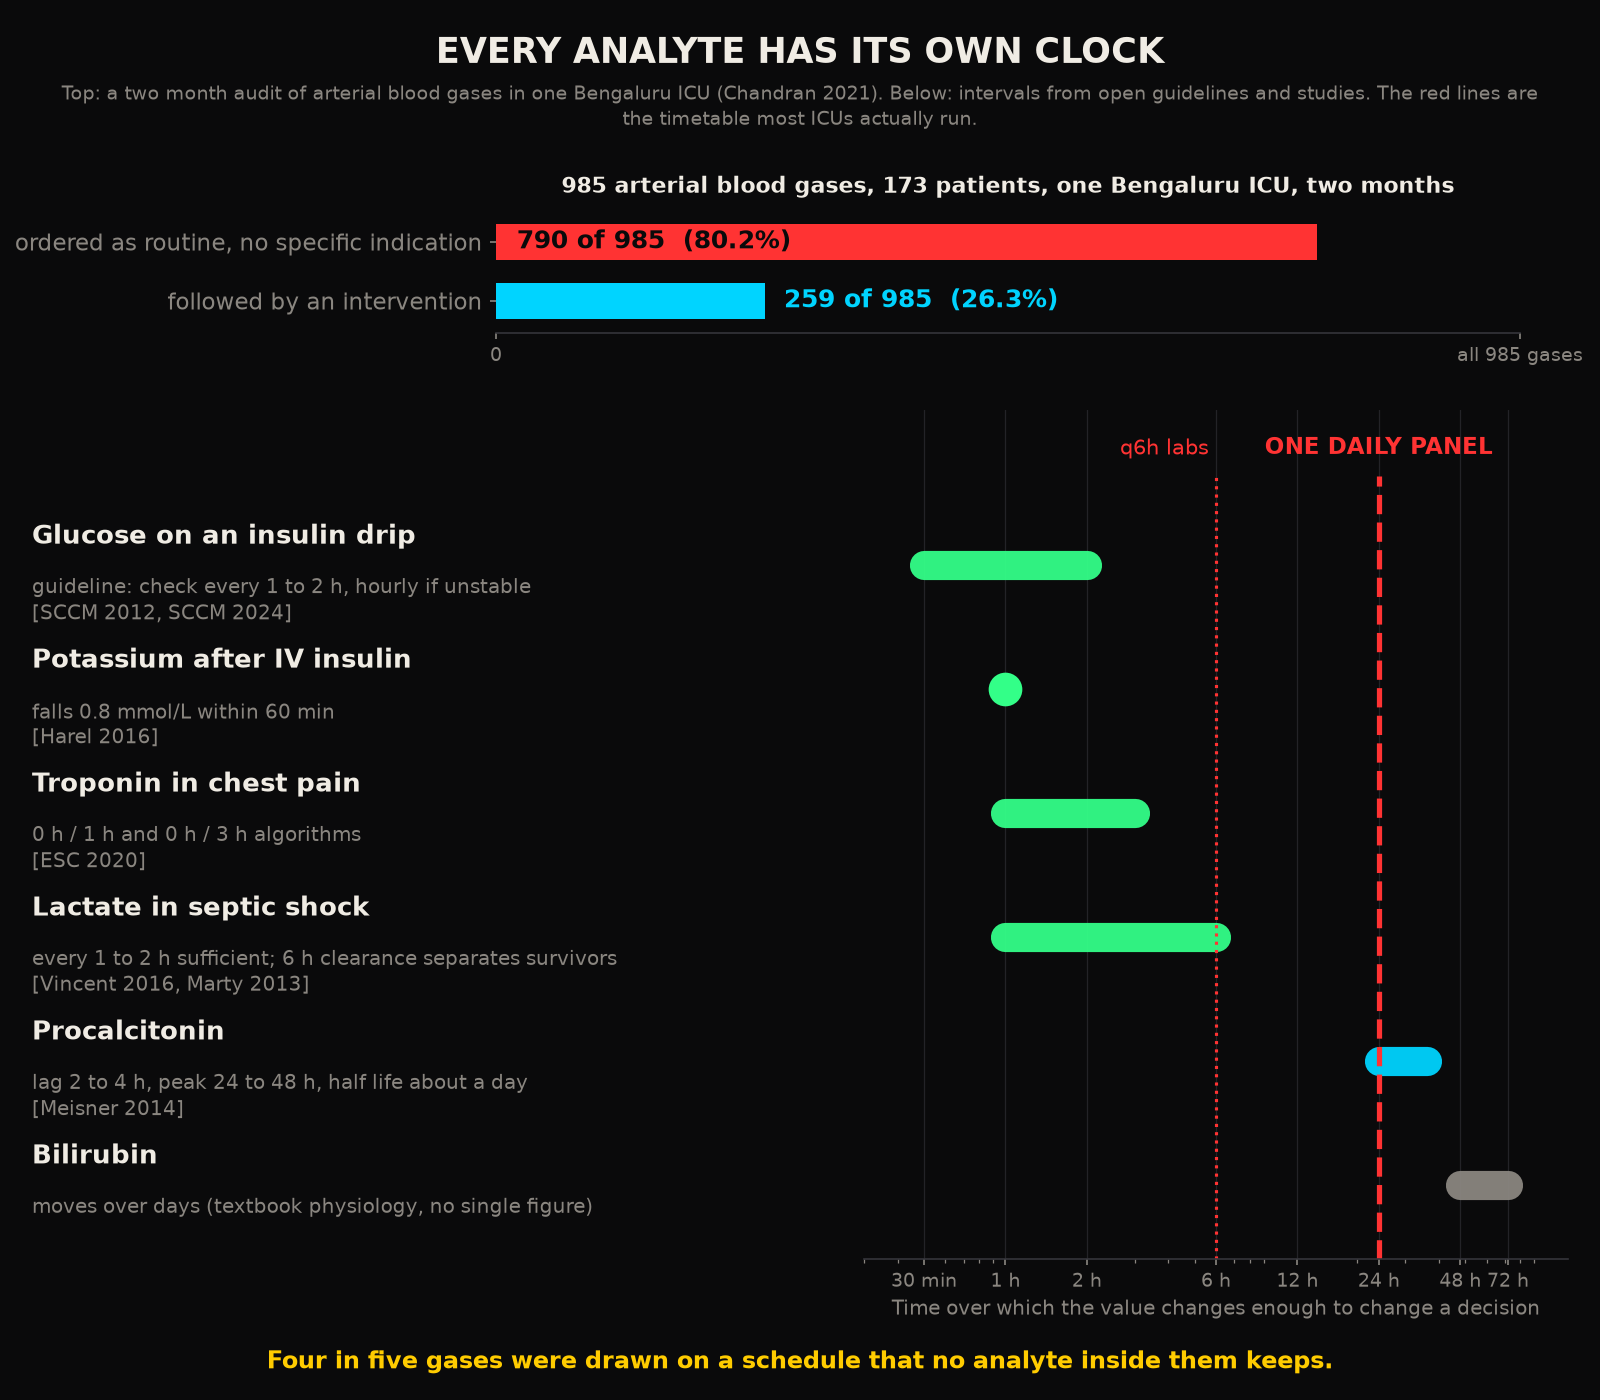
So the panel holds at least one analyte that needs a reading every hour, several that need one every few hours, and two that are fine once a day. Here they are on one axis.
2What a timetable does to a clock
In the first post of this series I argued that ICU biochemistry violates the sampling theorem. The theorem says you have to sample a signal at least twice as often as its fastest meaningful change, or the reconstruction aliases. Aliasing does not hand you an obviously wrong signal. It hands you a smooth, believable signal that is a mathematical fiction. That is exactly why it is dangerous.
Figure 1 adds a second layer to that argument. The violation is a different number for every row of the panel. A daily panel oversamples bilirubin and undersamples glucose by a factor of twenty four. A six hourly panel is roughly right for lactate on a quiet day and wrong for lactate on a bad day. For glucose and potassium it is wrong on every day. There is no interval that satisfies all eight rows. This is exactly why every fixed schedule anyone has ever written is a compromise. The compromise was never chosen on purpose. It was inherited.
What the compromise does to a fast analyte is easy to show. The trace below is an illustration, drawn to behave like glucose on an insulin infusion, with the kind of dip that NICE-SUGAR was counting. It is the same twenty four hours, sampled three ways.
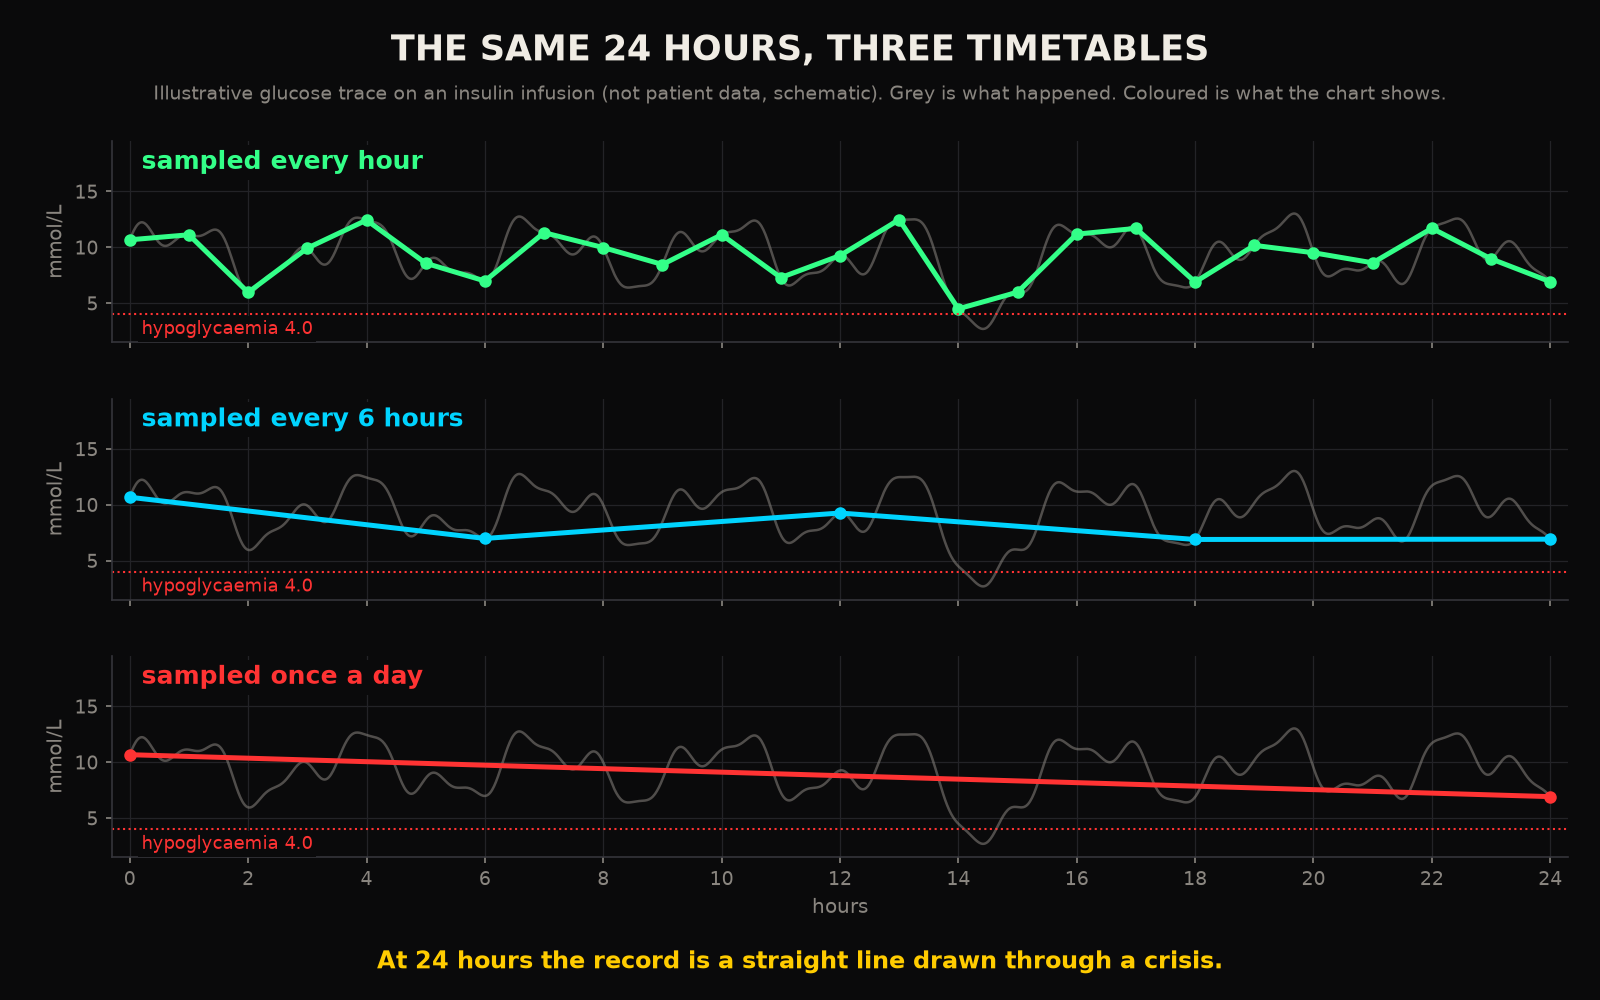
The six hourly chart is the dangerous one, because it is plausible. You would not order a repeat on it. The daily chart is so sparse that a clinician instinctively distrusts it. That instinct is the only protection the patient has.
3A timetable that was never chosen
So who chose the daily draw? Ask the professional societies and the answer is that it should never have been chosen at all. The first item on the Choosing Wisely list for critical care, signed by four American societies, reads: do not order diagnostic tests at regular intervals (such as every day), but rather in response to specific clinical questions
15. That sentence is a confession. The schedule exists, it is daily, and the people who wrote the guidelines are asking their own members to stop following it.
The audits say the same thing from the other side. A French ICU was running 37 laboratory tests per patient per day at baseline, and cut that to 15 with an education programme and no measurable harm16. A Geneva ICU was drawing 8.2 arterial blood gases per patient per day and halved it with a guideline and monthly feedback17. In a two month audit at a Bengaluru ICU, 985 blood gases were drawn in 173 patients, 80 percent of them as routine with no specific indication, and only 26 percent led to any change in management18. Four out of five draws were answering no question. They were on the schedule.
Read those three numbers together and the shape of the problem is clear. The unit is drawing far too much of the slow analytes and far too little of the fast ones. The sum of those two errors looks, on a budget line, like a reasonable amount of testing. What I mean by that is the total is defensible and the allocation is wrong, because the clock doing the allocating belongs to the phlebotomy roster. INDICAPS-II, the national case mix study, puts ICU mortality in India at 23.4 percent across 132 units19. None of the measurement intervals those units are running was derived from the physiology of what it measures.
What happens between draws is where the damage is. In the first post I called those gaps invisible windows. The point of this post is that the windows are a different width for every analyte. For bilirubin the window is comfortably narrower than the physiology. For glucose on insulin it is twenty times wider. That is where your patient is crossing thresholds you will not see until the next round.
4The economics are on the patient's side
The usual objection at this point is cost. If every analyte needs its own clock and the fast clocks tick every hour, surely the bill for the fast ones is what stops the unit from running them.
It is the reverse. The analytes that need the fastest sampling are the cheapest measurements in the laboratory, because they are electrochemical: an ion selective electrode, an enzyme electrode, a gas sensor. The expensive measurements are the immunoassays. The immunoassays are the slow analytes. A public hospital tariff makes the point without any help from me. At AIIMS Bathinda a glucose costs ₹20, a potassium ₹25 and a blood gas ₹50, while a troponin costs ₹300 and a procalcitonin ₹75020. The CGHS reimbursement schedule lists procalcitonin at ₹1,80021.
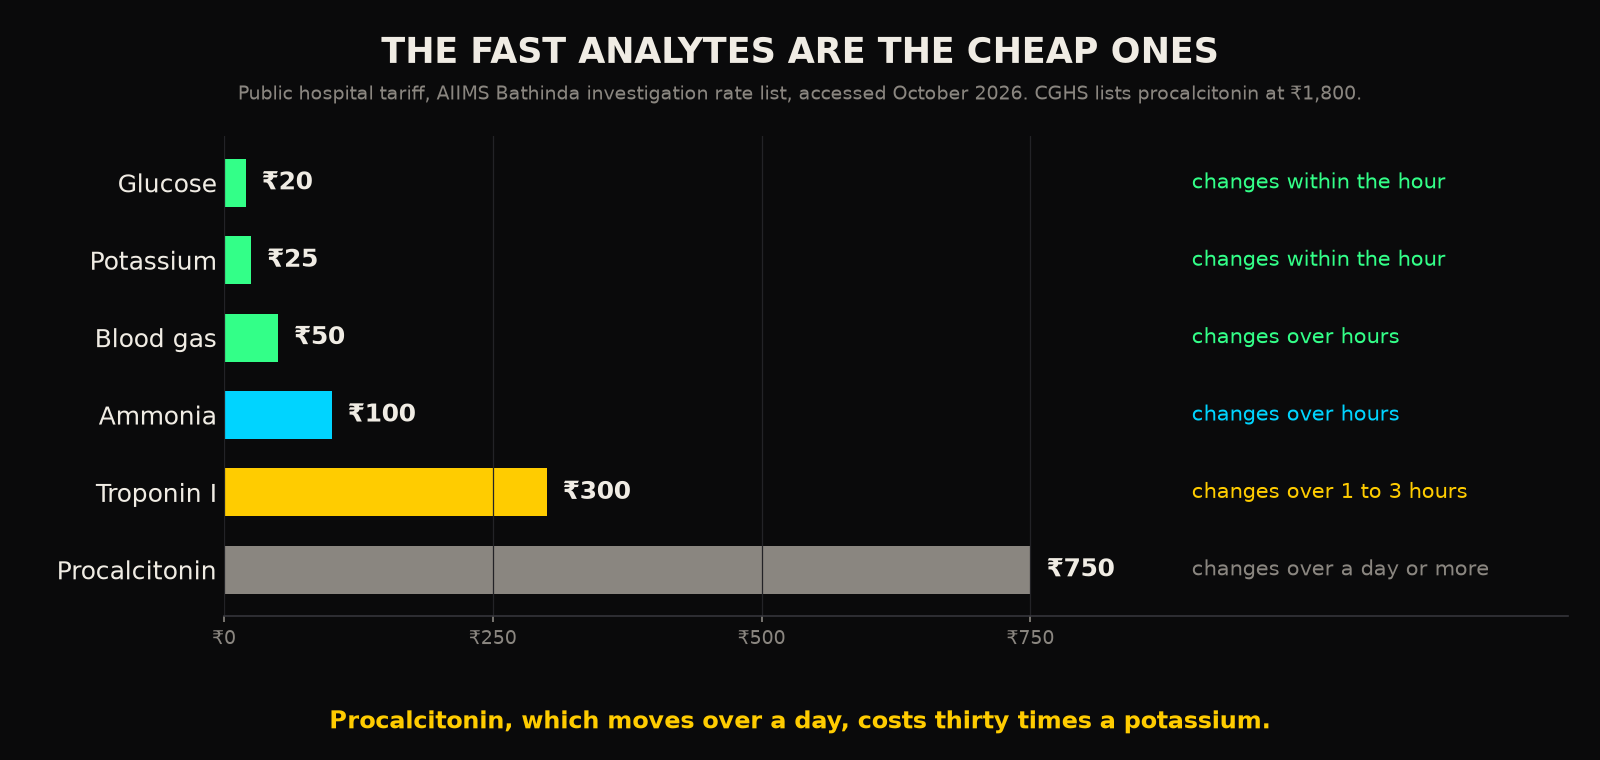
Basically, nature is on the patient's side here. The things worth measuring every hour cost almost nothing to measure. The things that cost real money are the ones you only need once a day. A measurement schedule designed from the physiology would be cheaper than the one your ward is running now. It would stop paying for daily bilirubins on patients whose liver is fine and start spending twenty rupees an hour on the glucose and potassium of the patient on the drip.
What stops this is neither money nor knowledge. The guideline for the glucose exists1, the one hour troponin algorithm exists7, the lactate kinetics have been reviewed across 96 studies8. The gap is structural. The sampling schedule is one global cycle, built around the labour of drawing blood and the batching of a central laboratory. A single cycle is being asked to serve eight clocks and it cannot. One honest limit on all of this: the audits show that the slow draws can be cut without harm. They do not show that an hourly potassium on a drip changes survival, because that trial is not among the studies I am citing.
5What this means
If you are running a unit, the implication is immediate and it costs nothing. The interval belongs to the analyte. The patient on an insulin infusion is also a patient whose potassium is on an hourly clock, whatever the panel says. If you are building the measurement layer that will eventually replace the panel, the implication is a design constraint. The architecture has to allocate a sampling rate per analyte, with the cheap electrochemical channels running fast and the expensive immunoassays running slow. Any single cycle you pick will either alias the fast analytes or waste blood and money on the slow ones.
The phlebotomist will be back at 6 AM. The bilirubin will be unchanged. The potassium will be whatever insulin and the night made it. The glucose chart will be the only line on the ward that was drawn at the speed of the thing it describes.
A single timetable is being asked to describe eight different clocks. It is describing none of them.
RReferences
- 1.Jacobi J, Bircher N, Krinsley J, et al. Guidelines for the use of an insulin infusion for the management of hyperglycemia in critically ill patients. Crit Care Med. 2012;40(12):3251-3276.
- 2.Honarmand K, Sirimaturos M, Hirshberg EL, et al. Society of Critical Care Medicine guidelines on glycemic control for critically ill children and adults 2024. Crit Care Med. 2024;52(4):e161-e181.
- 3.NICE-SUGAR Study Investigators. Intensive versus conventional glucose control in critically ill patients. N Engl J Med. 2009;360(13):1283-1297. Open repository copy.
- 4.Krinsley JS, Egi M, Kiss A, et al. Diabetic status and the relation of the three domains of glycemic control to mortality in critically ill patients: an international multicenter cohort study. Crit Care. 2013;17(2):R37.
- 5.Bagshaw SM, Bellomo R, Jacka MJ, et al. The impact of early hypoglycemia and blood glucose variability on outcome in critical illness. Crit Care. 2009;13(3):R91.
- 6.Harel Z, Kamel KS. Optimal dose and method of administration of intravenous insulin in the management of emergency hyperkalemia: a systematic review. PLoS One. 2016;11(5):e0154963.
- 7.Collet JP, Thiele H, Barbato E, et al. 2020 ESC guidelines for the management of acute coronary syndromes in patients presenting without persistent ST-segment elevation. Eur Heart J. 2021;42(14):1289-1367.
- 8.Vincent JL, Quintairos e Silva A, Couto L, Taccone FS. The value of blood lactate kinetics in critically ill patients: a systematic review. Crit Care. 2016;20(1):257.
- 9.Marty P, Roquilly A, Vallée F, et al. Lactate clearance for death prediction in severe sepsis or septic shock patients during the first 24 hours in intensive care unit: an observational study. Ann Intensive Care. 2013;3(1):3.
- 10.Levy MM, Evans LE, Rhodes A. The Surviving Sepsis Campaign bundle: 2018 update. Intensive Care Med. 2018;44(6):925-928.
- 11.Evans L, Rhodes A, Alhazzani W, et al. Surviving Sepsis Campaign: international guidelines for management of sepsis and septic shock 2021. Intensive Care Med. 2021;47:1181-1247.
- 12.Bhatia V, Singh R, Acharya SK. Predictive value of arterial ammonia for complications and outcome in acute liver failure. Gut. 2006;55(1):98-104.
- 13.European Association for the Study of the Liver. EASL clinical practical guidelines on the management of acute (fulminant) liver failure. J Hepatol. 2017;66(5):1047-1081. Official PDF.
- 14.Meisner M. Update on procalcitonin measurements. Ann Lab Med. 2014;34(4):263-273.
- 15.Halpern SD, Becker D, Curtis JR, et al. An official ATS/AACN/ACCP/SCCM policy statement: the Choosing Wisely top 5 list in critical care medicine. Am J Respir Crit Care Med. 2014;190(7):818-826. Official PDF.
- 16.Clouzeau B, Caujolle M, San-Miguel A, et al. The sustainable impact of an educational approach to improve the appropriateness of laboratory test orders in the ICU. PLoS One. 2019;14(5):e0214802.
- 17.Merlani P, Garnerin P, Diby M, Ferring M, Ricou B. Linking guideline to regular feedback to increase appropriate requests for clinical tests: blood gas analysis in intensive care. BMJ. 2001;323(7313):620-624.
- 18.Chandran J, D'Silva C, Sriram S, Krishna B. Clinical utility of arterial blood gas test in an intensive care unit: an observational study. Indian J Crit Care Med. 2021;25(2):172-175.
- 19.Divatia JV, Mehta Y, Govil D, et al. Intensive care in India in 2018-2019: the second Indian intensive care case mix and practice patterns study (INDICAPS-II). Indian J Crit Care Med. 2021;25(10):1093-1107.
- 20.AIIMS Bathinda. Investigation rate list. Accessed October 2026.
- 21.Directorate General of CGHS, Ministry of Health and Family Welfare. Office memorandum on CGHS rates for new investigations, 14 January 2020 (procalcitonin ₹1,800).
Declarations
Competing interests. The author is the founder of Aethryva Deeptech, which develops the tachyDx platform and the MOISSCode language. Where an article in this series mentions either, it says so in the text and the mention follows the argument.
Sources and figures. Every reference in this article is an open access source that any reader can open without payment. The figures were drawn by the author from the values printed in those sources, or are labelled as schematic where no published value exists. No patient data were used.
Cite this article
Kunche N. One sampling timetable cannot follow analytes that change at different speeds. The Intervention. 9 April 2026. https://nikhilkunche.com/blog/one-sampling-timetable-for-analytes-that-change-at-different-speeds
Comments