
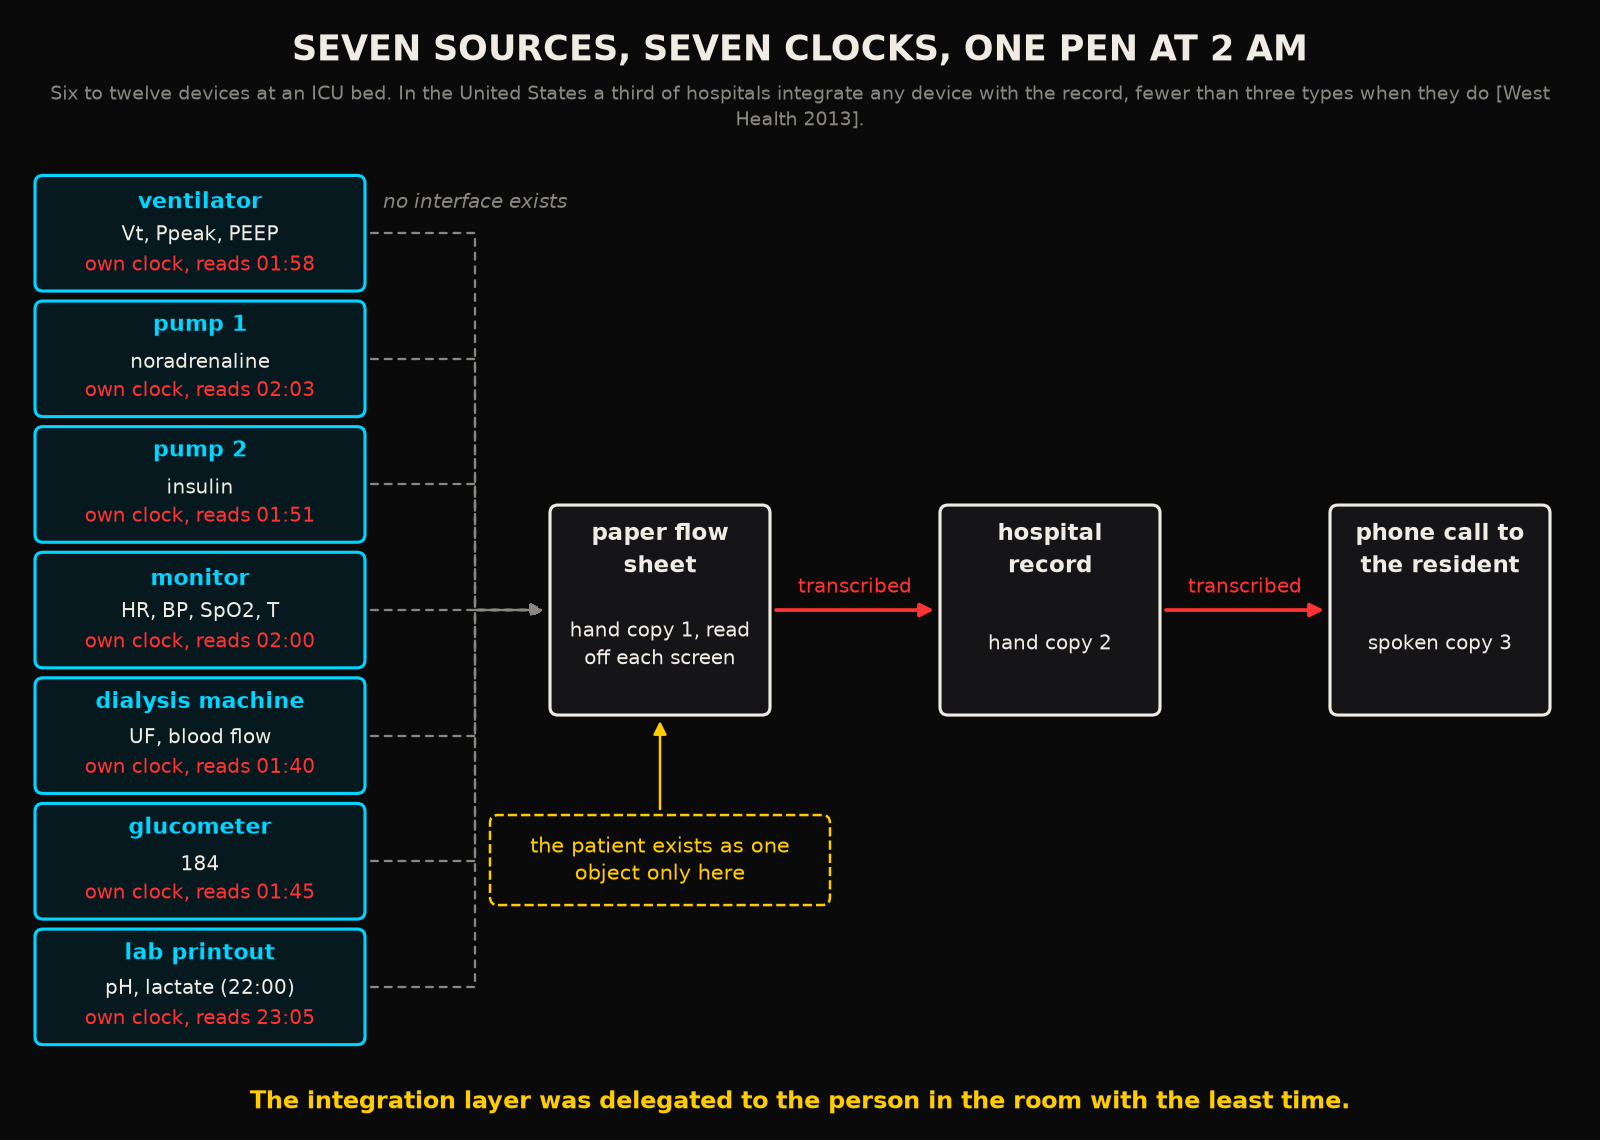
It is 2 AM in bed 7 of a twelve bed ICU in a private hospital in Hyderabad, and the nurse has the hourly round to do. The ventilator says a tidal volume and a peak pressure. The first pump says the noradrenaline rate, the second says the insulin. The monitor says a heart rate, a blood pressure, a saturation, a temperature. The dialysis machine says an ultrafiltration volume and a blood flow. The glucometer says 184. The printout from the 10 PM blood gas (the ward boy brought it up at 11) says a pH and a lactate. She writes each of these numbers onto the paper flow sheet clipped to the foot of the bed. Then she walks to the nursing station and types them into the hospital's record. Then she rings the resident, who is in the other ICU, and reads him the ones he asks for.
You have done this round yourself, or watched someone do it. That is three transcriptions, one patient, every hour, for each of the two patients she is covering tonight. Seven screens are describing one human being. The only place where all seven descriptions meet is her handwriting.
1Seven screens and no shared clock
There is no good peer reviewed count of devices per ICU bed, which is itself a small scandal. So the most quoted figure comes from an industry analysis: six to twelve devices around an ICU bed, with only a third of hospitals connecting any medical device to their record, and those that do integrating fewer than three types1. The same analysis costed the manual entry of device readings at about twelve billion dollars a year in the United States alone, out of a total addressable waste it put above thirty billion1. Those are advocacy numbers from 2013 and you should read them as such. Nothing published since has contradicted the shape of them.
The reason is structural. Reviewers of ICU monitoring systems have been naming it for a decade: incompatibilities among monitoring equipment, proprietary limitations from industry, and the absence of standard data formatting2. Each vendor's device keeps its own log, in its own format, on its own clock. The regulator defines interoperability as the ability to safely, securely and effectively exchange and use information among devices, and lists reducing errors and adverse events as the first benefit3. The definition exists because the property is rare. When a German university hospital set out to actually do it, the project needed a dedicated integration layer wrapping each proprietary interface. Over two years that layer processed more than ten million bidirectional messages and integrated more than four and a half million readings4. Fully automated capture from bedside devices is feasible. It is also a two year engineering project that most hospitals will never fund.
So the integration is done by a person. That step was never designed. The work fell to whoever was standing closest to the screens.
2What the pen costs
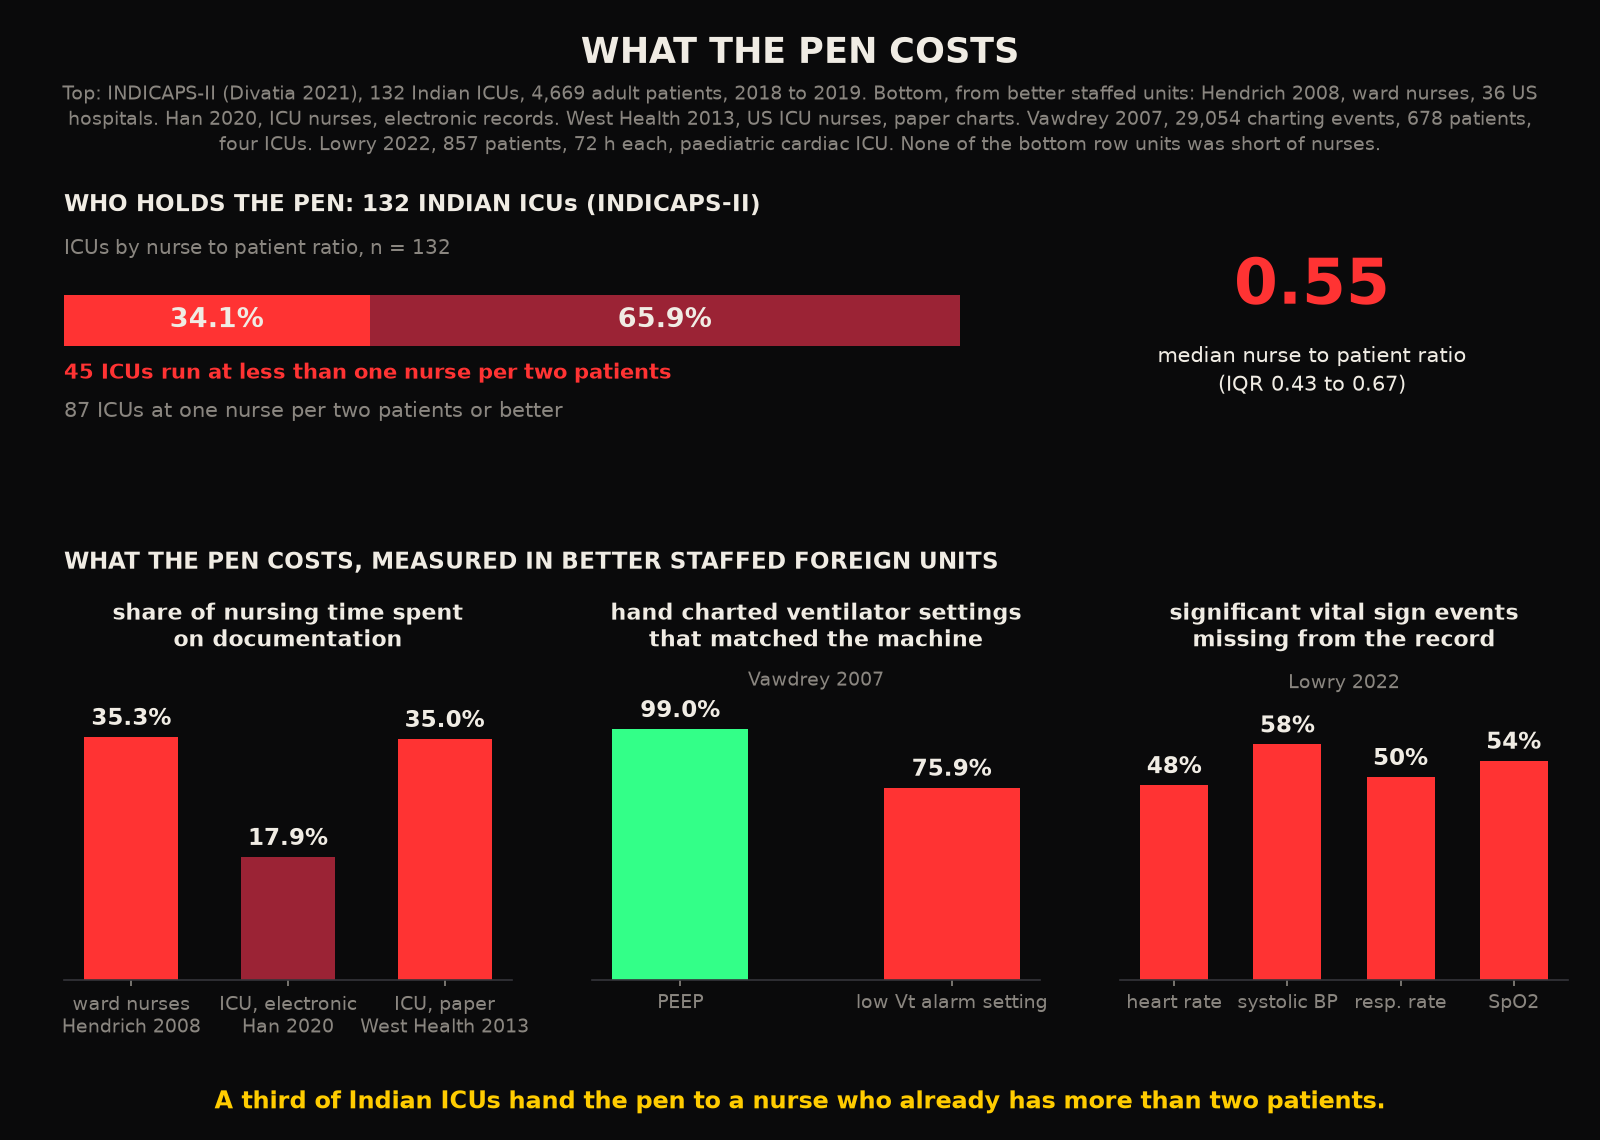
Start with time, because time is the thing the nurse has least of. In a time and motion study across 36 American hospitals and 767 medical and surgical nurses, documentation took 35.3 percent of practice time, about 147 minutes of a shift5. Assessing patients and reading their vital signs got 7.2 percent, 31 minutes5. Those are ward nurses. In an ICU in China where electronic nursing records were already in place, 30 nurses observed for 580 hours still spent 17.9 percent of their time on documentation and another 17.6 percent on communication, with direct care at just over half6. The industry analysis above, citing an older ICU study, put the documentation share at about 35 percent of a nurse's shift1. Pick whichever figure you prefer. Between a fifth and a third of the most expensive hour in the hospital is being spent copying numbers from one surface to another.
Then there is what the copying does to the numbers. In four ICUs over twelve months, 29,054 ventilator charting events on 678 patients were compared with what the ventilator itself recorded. Agreement ranged from 99 percent for PEEP down to 75.9 percent for the low tidal volume alarm setting7. Of 14,263 computerised protocol suggestions, 559, or 3.9 percent, were built on at least one hand charted value that did not match the machine7. Each charting event took an average of 6.1 minutes, 1.8 of them spent entering data7. Basically the protocol was being run on a copy of the patient. The copy was wrong often enough to matter.
Vital signs are worse, because they move faster than the hourly round. In a paediatric cardiac ICU, 857 postoperative patients were monitored continuously for 72 hours and the automatically captured stream was compared with the flowsheet. Significant heart rate, systolic pressure, respiratory rate and saturation events were missing from the record 48, 58, 50 and 54 percent of the time respectively8. A third of the physiologically implausible readings had nonetheless been documented8. A 2026 prospective study in another paediatric ICU found that three of eight vital signs in the record failed a ten percent concordance threshold against the monitor. The outliers were as large as a 31 mmHg difference in systolic pressure and an 87 beat difference in heart rate. Concordance for continuous medication dosing was around 31 percent9. These are small studies in well resourced units with electronic records. The flowsheet you are reading on your round is a sparse, lagging, occasionally fictional sample of what the monitor saw.
Does automation give the time back? The honest answer from the pooled literature is mixed. A systematic review of 33 studies found that electronic record implementations raised nursing documentation time, by 22 and 46 percent in two weighted averages, while barcode medication administration cut medication time by a third11. Where the automation removed a transcription, time fell. Where it added a screen to type into, time rose. The scoping review of integrated devices in acute care found only 18 studies in a decade, most of them on pumps and vital sign machines. It warned that poorly tailored decision support leaves clinicians at risk of alert fatigue12. A natural experiment across more than 5,000 patients and 330,000 documentation events reported a significant fall in the lag between measurement and charting once monitors fed the record directly10. The lesson is specific. Integration helps exactly when it deletes a human copy step. It hurts when it adds one.
3The Indian bedside
The problem is that everything above was measured in hospitals with one nurse per patient or two, and with an electronic record to copy into. INDICAPS-II, the second national survey of Indian intensive care, covered 132 ICUs and 4,669 patients. The median nurse to patient ratio was 0.55. One in three units ran at less than one nurse per two patients (the nurse in bed 7 is the rule). Eighty five percent were open units with no full time intensivist in charge13. These surveys measure staffing. The transcription error rates above are borrowed from better staffed units. Electronic capture of ICU data in India is a recent, society led initiative. The national critical care society's CHITRA database was the first attempt to get units storing structured data at all, and the single centre that reported from it published its secular trends in 201914. A 2021 perspective on electronic ICUs in India described the potential as great and the roadblocks as many15.
In the absence of an integration layer, Indian clinicians built one themselves, and it is WhatsApp. Among surveyed Indian dermatologists, 86 percent were sharing clinical images in professional WhatsApp groups and 14 percent recorded consent16. Among Maharashtra dentists, 88 percent named WhatsApp as the preferred channel for patient data and under half consistently took consent17. A letter in the Indian Journal of Medical Ethics described the trend among Indian doctors of sharing patient images and investigation results in WhatsApp chats as simply the way things are done18. The resident in the other ICU is going to ask the nurse to photograph the blood gas printout and send it. That photograph is the most reliable data transfer that will happen in bed 7 tonight. It goes into a chat thread that cannot be searched, trended or audited.
4Integration was delegated
Put the pieces together and the shape of the problem is clear. The devices do not talk to each other because their makers have no commercial reason to make them. The hospital does not build the integration layer because it costs two years of engineering. So the integration is delegated to the nurse. Who signed off on her as the integration layer? That decision was never taken. It happened by default, one shift at a time. She has between a fifth and a third of her shift to do it, carries two or three patients, and transcribes by hand at an error rate the ventilator study measured and the vital sign studies found to be worse. Then a resident, working from the phone call or the photograph, makes decisions on the copy. Then a researcher, years later, trains a model on the copy of the copy.
No part of this chain can reason about the patient as a whole, because the patient as a whole does not exist in any system. He exists at the intersection of seven logs that have never been joined, and in a flow sheet that is right three quarters of the time. This is exactly why the earlier posts in this series kept returning to invisible windows. The lab draws too rarely. Even the values which are captured continuously are being thrown away at the human step, and they arrive in the record as a sparse, delayed, hand copied sketch.
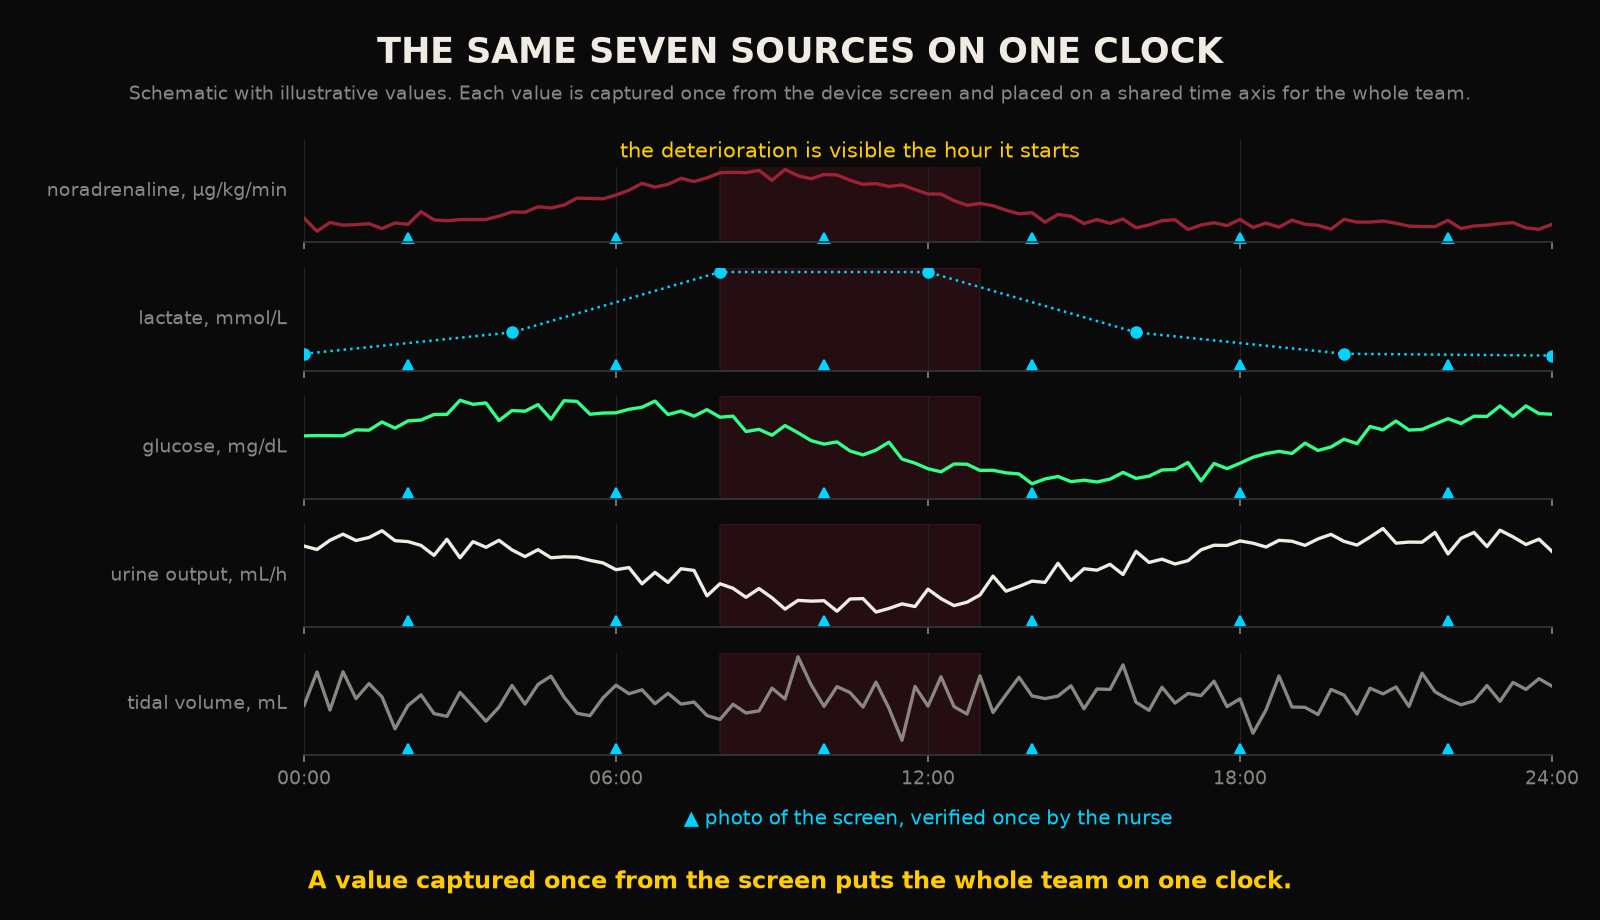
What was built to close this part of it is tachyDx Teams. The nurse photographs the monitor, the pump or the lab printout with her phone. The values come back as structured fields on one chart with one clock, and she verifies them once, which replaces the three transcriptions with a single check. The whole team sees the same patient list and the same trends on their phones and desktops, and it sits alongside whatever record the hospital already keeps. An intensivist has been running it on her own phone since July. What it does not do is see anything between the draws, because the biochemistry of the patient between one blood gas and the next is still invisible to it, as it is to everything else on the unit, and the sensing layer that fixes that is a different problem from the one this post is about.
Back in bed 7 the round is done, the flow sheet is filled in, the record is updated, and the resident has the numbers he asked for. Nothing was integrated. Seven devices were read by one person. The most important data pipeline in the hospital turned out to be a ballpoint pen, as it has been for as long as there have been ICUs.
RReferences
- 1.West Health Institute. The value of medical device interoperability: improving patient care with more than $30 billion in annual health care savings. San Diego: Gary and Mary West Health Institute; March 2013.
- 2.De Georgia MA, Kaffashi F, Jacono FJ, Loparo KA. Information technology in critical care: review of monitoring and data acquisition systems for patient care and research. ScientificWorldJournal. 2015;2015:727694.
- 3.US Food and Drug Administration. Medical device interoperability. Digital Health Center of Excellence.
- 4.Martens E, Haase HU, Mastella G, et al. Smart hospital: achieving interoperability and raw data collection from medical devices in clinical routine. Front Digit Health. 2024;6:1341475.
- 5.Hendrich A, Chow MP, Skierczynski BA, Lu Z. A 36-hospital time and motion study: how do medical-surgical nurses spend their time? Perm J. 2008;12(3):25-34.
- 6.Han B, Li Q, Chen X, Zhao G. Workflow for intensive care unit nurses: a time and motion study. SAGE Open. 2020;10(3).
- 7.Vawdrey DK, Gardner RM, Evans RS, et al. Assessing data quality in manual entry of ventilator settings. J Am Med Inform Assoc. 2007;14(3):295-303.
- 8.Lowry AW, Futterman CA, Gazit AZ. Acute vital signs changes are underrepresented by a conventional electronic health record when compared with automatically acquired data in a single-center tertiary pediatric cardiac intensive care unit. J Am Med Inform Assoc. 2022;29(7):1183-1190.
- 9.Pham D, Tachinardi P, Bulgarelli L, et al. Assessment of electronic clinical monitoring systems in the pediatric intensive care unit: prospective concordance study. JMIR Form Res. 2026;10:e93017.
- 10.Buxton B, Knight J, Shrivastava U. Implications of vital sign monitor and electronic medical record integration on identification of patients in deteriorating condition. Transactions of the International Conference on Health Information Technology Advancement. 2019; paper 66.
- 11.Moore EC, Tolley CL, Bates DW, Slight SP. A systematic review of the impact of health information technology on nurses' time. J Am Med Inform Assoc. 2020;27(5):798-807.
- 12.Withall JB, Schwartz JM, Usseglio J, Cato KD. A scoping review of integrated medical devices and clinical decision support in the acute care setting. Appl Clin Inform. 2022;13(5):1223-1236.
- 13.Divatia JV, Mehta Y, Govil D, et al. Intensive care in India in 2018-2019: the second Indian intensive care case mix and practice patterns study (INDICAPS-II). Indian J Crit Care Med. 2021;25(10):1093-1107.
- 14.Varma MK, Krishna B, Sampath S. Secular trends in an Indian intensive care unit-database derived epidemiology: the STRIDE study. Indian J Crit Care Med. 2019;23(6):251-257.
- 15.Iyengar KP, Garg R, Jain VK, Malhotra N, Ish P. Electronic intensive care unit: a perspective amid the COVID-19 era. Need of the day! Lung India. 2021;38(Suppl):S97-S100.
- 16.Janagond AB, Inamadar AC. Clinical photography in dermatology: perception and behavior of dermatologists. A pilot study. Indian Dermatol Online J. 2021;12(4):555-560.
- 17.Joshi NV, Jawdekar A, Joshi M, Shetty AR, Vaz M, Sachdev SS. Knowledge, attitude, and practices of dentists in Maharashtra, India, regarding sharing patients' data on social media: a questionnaire-based study. Cureus. 2025;17(7):e88778.
- 18.Bal AM. WhatsApp, Doc? Indian J Med Ethics. 2017;2(1).
Declarations
Competing interests. The author is the founder of Aethryva Deeptech, which develops the tachyDx platform and the MOISSCode language. Where an article in this series mentions either, it says so in the text and the mention follows the argument.
Sources and figures. Every reference in this article is an open access source that any reader can open without payment. The figures were drawn by the author from the values printed in those sources, or are labelled as schematic where no published value exists. No patient data were used.
Cite this article
Kunche N. ICU device integration is still done by a nurse with a pen. The Intervention. 26 June 2026. https://nikhilkunche.com/blog/icu-device-integration-is-still-done-by-a-nurse-with-a-pen
Comments