
The engineer has been waiting two years for this afternoon. The lactate electrode is in a femoral line, the patient is a consenting adult on a research protocol, and the trace on the laptop is sitting on top of the laboratory values like it was drawn there. Hour four, hour eight, hour twelve: every reference sample lands inside the band. The estimator around the sensor is reporting a lactate of 2.1 with a confidence interval you could hide behind a pencil line.
By hour sixteen the current from the electrode has started to fall. Nothing on the screen says so. The reading is 1.8 now. The band is as tight as it was at noon. The reference sample drawn at hour eighteen comes back at 2.6. The patient is getting worse and the sensor is saying the opposite, with the same confidence it had when it was right.
Every intravascular sensor programme eventually plays out this scene. If you have run one, you have your own version of hour sixteen. The interesting question is what the software should have done at that hour. The answer is in a piece of mathematics that is older than the sensor, and it has very little to do with the chemistry.
1Every electrode in blood fouls
The first thing to accept is that fouling is the normal condition of a sensor in blood. Thirty years of work on in vivo chemical sensors for oxygen, carbon dioxide, pH, glucose and lactate has turned on one problem. The problem is biology. Clot formation on intravascular sensors and the foreign body response around subcutaneous ones are what make the readings wrong1. The chemistry at the electrode is usually fine. What changes is the layer of protein, platelets and fibrin that builds on the membrane and alters what reaches it.
The size and the speed of that effect have been measured. When oxygen sensing catheters were placed in rabbit veins and pig arteries, the sensors with a nitric oxide releasing coating read within an average of 2 percent of the in vitro reference across the run, with a correlation of 0.97. The control sensors were identical except for the coating. They were reading on average 31 percent low, with a standard deviation of 28 percent and a correlation of 0.43, at every time point beyond four hours in veins and six hours in arteries2. The uncoated sensors had also grown more thrombus on the catheter surface. That is the drift signature the engineer saw at hour sixteen, from a laboratory that has been characterising it since the nineties.
The commercial history says the same thing in a different register. The Paratrend family of intravascular blood gas sensors performed well across a wide range of values on the bench. Performance in patients was not as satisfactory, especially for PO2 values
3. The monitors used on cardiopulmonary bypass, where the sensor sits in an external circuit and the blood is heparinised, did better. Across 75 cases at four sites the CDI 500 showed a pH bias of 0.00 with a standard deviation of 0.02 and a carbon dioxide bias of 0.3 mmHg4. The oxygen bias was 7.5 mmHg with a standard deviation of 13.8. Potassium was off by about 0.12 mmol/L4. Even there, the device without gas calibration was completely unreliable
until it had been calibrated in vivo against a reference analyser. After that the two calibration arms were indistinguishable5. The channel is only as trustworthy as its last calibration.
The best characterised in vivo electrochemical sensor is the factory calibrated continuous glucose monitor. It carries the same signature in miniature. In adults and youth the proportion of readings within 20 percent of the reference was 88.6 percent on day one of wear and 90.6 percent on day ten6. The day one mean absolute relative difference in a second cohort was 9.3 percent7. In children the figure was 92.1 percent on day one against 91.0 percent on day ten8. These are small differences in a mature product. The point is that accuracy is a function of time since insertion even when the manufacturer has done everything right. A sensor in arterial blood on a sick patient is a long way from that product.
2What the textbook filter does with a fouled sensor
Now put the standard estimator around that sensor. The Kalman filter has two noise terms. The process noise says how far the true state can wander between steps. The measurement noise, usually written R, says how far a reading can be from the truth. The gain of the filter, which decides how much of each new reading is believed, is a ratio of those two. The textbook is explicit about where R comes from. In the standard introduction, the process and measurement noise matrices might change with each time step or measurement, however here we assume they are constant
9. In practice the measurement noise covariance is usually measured prior to operation of the filter
9.
Read that against the fouling data. Basically R was measured on the bench, with a clean electrode, before the sensor went into the patient. It encodes the noise of the sensor at hour zero. At hour sixteen the membrane is coated, the current has fallen, and the reading is biased by a quarter. The filter has no term anywhere in it that can know. It keeps applying the hour zero gain to an hour sixteen sensor. What I mean by that is it keeps believing a reading that no longer deserves belief, and it reports the hour zero confidence band around the result.
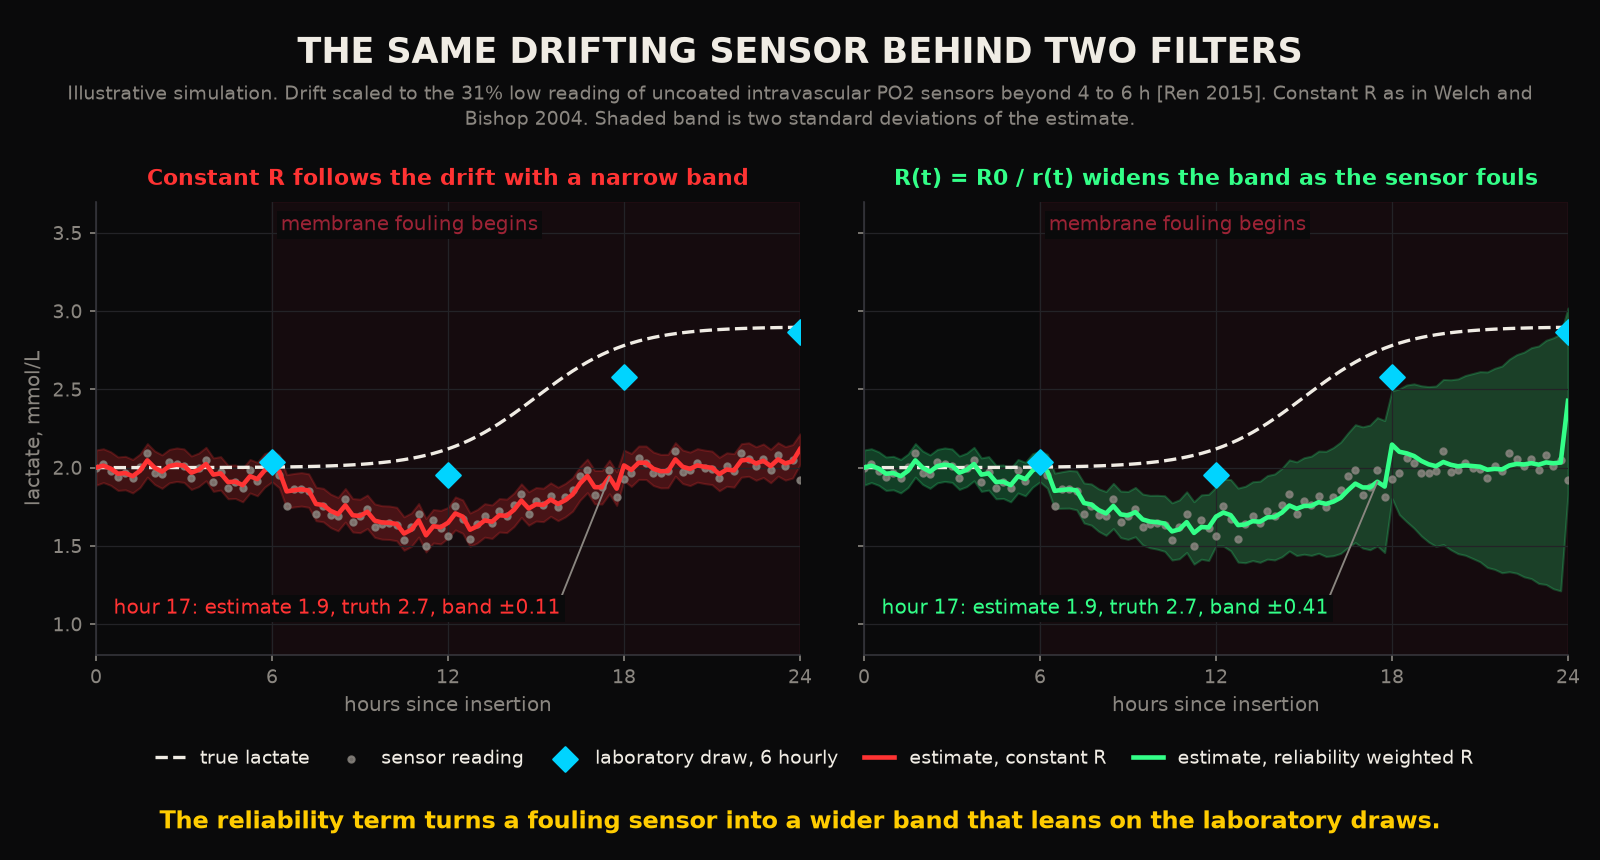
That is what the engineer was looking at. A confident wrong number is the characteristic output of a drifting sensor behind a constant R. It is worse than a noisy number. A noisy number announces itself. The constant R filter smooths the drift into a clean, plausible, narrowly bounded trajectory, and the clinician reading the screen has been given no reason to doubt it. This is the invisible window of series one in a new costume. The measurement arrives on time, looks fine, and describes yesterday's sensor.
3The honest output is a wider envelope
The fix is to stop treating R as a constant. There is a family of adaptive filters that estimate the noise terms afresh from the filter's own innovations, the differences between what it predicted and what arrived. It has been in the control literature for decades. The recent open formulations show that estimating R and the process noise online from the innovation and residual sequences makes the filter markedly less sensitive to a wrong initial guess than hand tuning10. That family is a power systems and navigation tradition. The precedent closer to the bedside is the heart rate work from the MIMIC group. Heart rate from the ECG and from the arterial pressure waveform were tracked with separate Kalman filters and fused by weighting each with a signal quality index applied to its innovations. The evaluation ran on more than 6,000 hours of simultaneously recorded data from 437 ICU patients11. Trust in a channel was a number that moved, computed in real time from how good the channel currently looked.
The version of this I published for chemistry channels is simple to state. The measurement noise at time t is the bench value divided by a reliability index: R(t) = R₀ / r(t), where r runs from one down to zero12. When the sensor is fresh and agreeing with everything else, r is one, R is the bench value, and the filter is the textbook filter. As r falls, R grows, the gain on that channel falls, and the filter leans on its model of the physiology and on the other channels. When r reaches zero, R is infinite, the gain is zero, and the measurement is simply not used. The filter runs on prediction until something trustworthy arrives. The reliability index itself is a product of four factors, and each can be computed without a reference sample: a decay with time since the electrode was last cleaned or replaced, a sawtooth that resets at each calibration, a coherence score for whether the reading is plausible given the other analytes, and a presence flag that says if anything arrived at all. Any one of them going to zero takes the whole index with it.
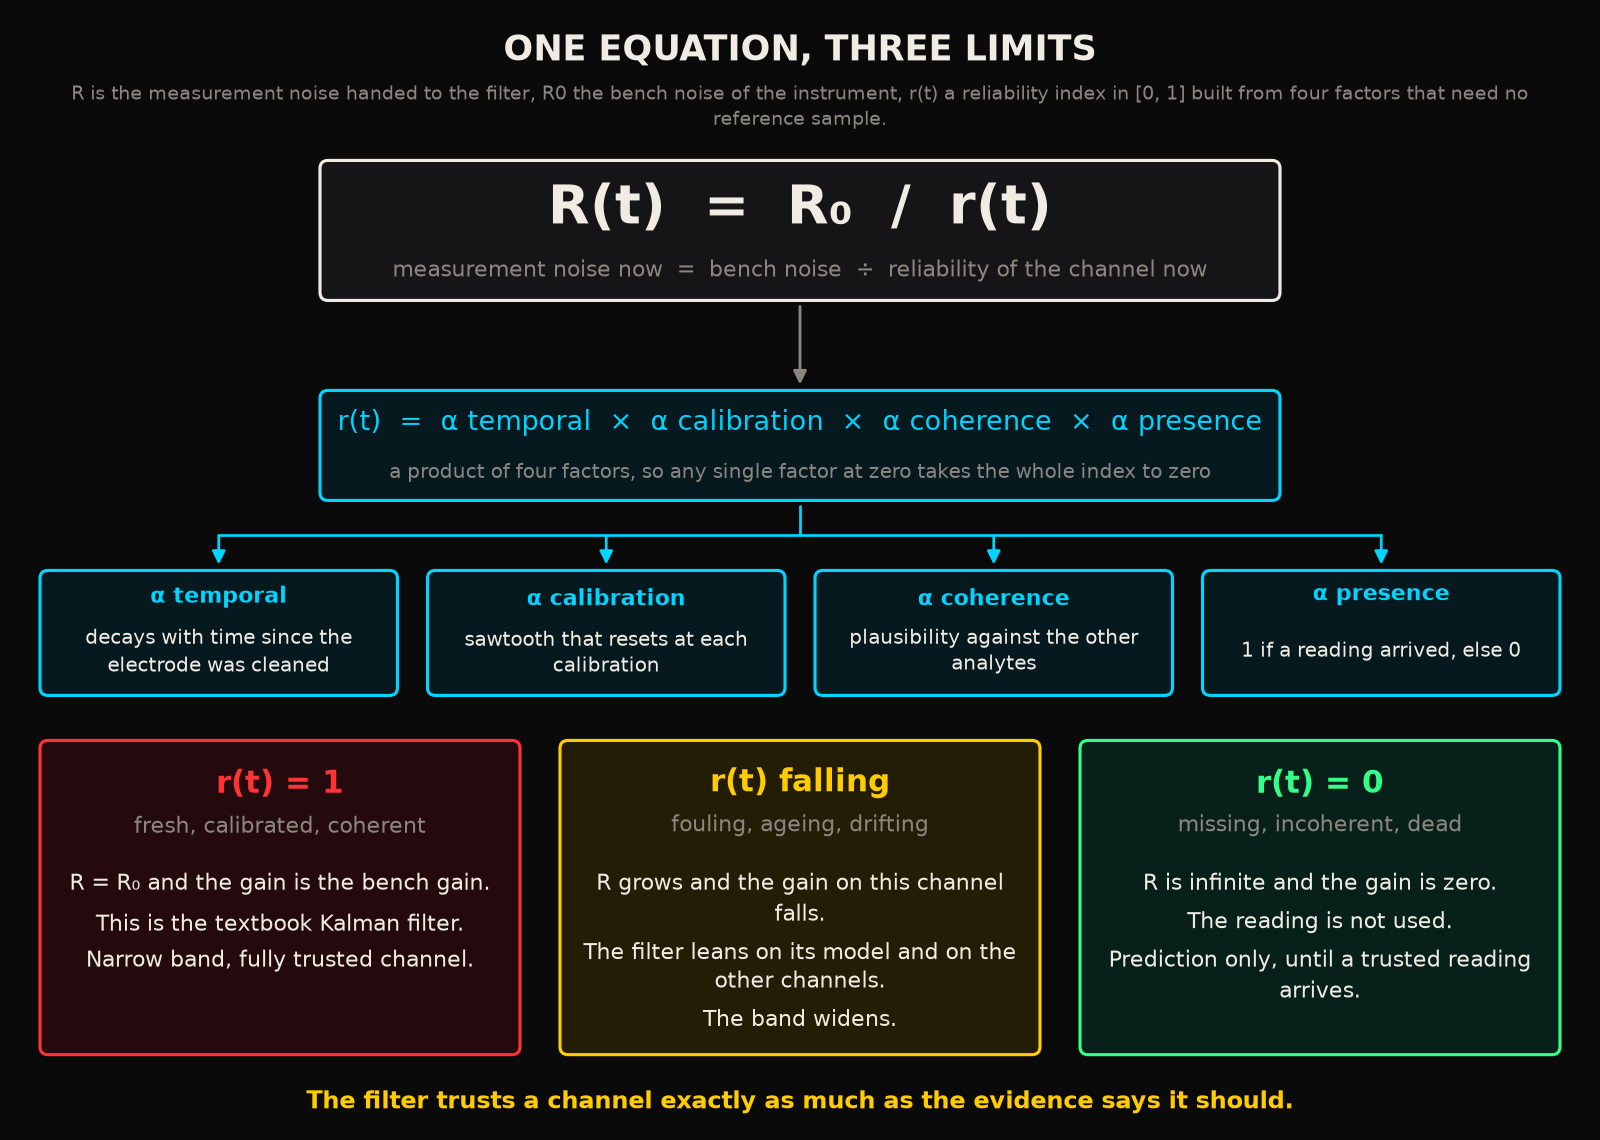
What this produces on the screen is the opposite of the confident wrong number. As the sensor fouls, the band around the estimate opens. When a trusted reading arrives from another channel, a laboratory draw or a second electrode, the filter moves to it because the fouled sensor has lost the argument. The widening funnel is the honest output. It says, in the only language an estimator has, that the information content of this channel is falling and that anyone acting on the number should know how far it could be wrong. In the preprint's simulation study, across twelve biomarkers and 144,000 Monte Carlo runs, the reliability weighted filter cut root mean square error by roughly 24 to 34 percent against the standard, extended and particle filters12. It detected simulated critical events in six to eleven minutes against twelve to nineteen for the baselines12. Those are simulation figures from a preprint that has not been peer reviewed (I wrote it, so weigh it accordingly). They describe behaviour, and a clinical result is a different thing. The behaviour is what matters here: trust that falls with evidence, and an envelope that admits it.
4The service interval becomes a measurement
Once the envelope is being computed, something useful happens to the maintenance schedule. Every sensor programme has a recalibration interval. It is set the way the ward's blood draw interval is set, by convention and by the manufacturer's worst case. The bypass monitors are calibrated in vivo at the start of a case because the uncalibrated device is unreliable5. The glucose monitors are factory calibrated and given a run in6. The sensor is never the one asking to be recalibrated, because the sensor has no way to ask.
A filter that carries R(t) can ask. Define, for each organ trajectory, the envelope width beyond which the estimate is no longer actionable. For lactate that is the width at which the estimate could be either clearing or climbing and you could not tell which. That width is a clinical statement, and it can be argued about on clinical grounds. Then let the uncertainty drive the service. When the envelope approaches the limit, recalibrate, or flush, or replace the electrode. After the event the reliability index resets and the envelope collapses. Between events it grows. As the electrode ages the growth gets faster and the intervals get shorter, which is exactly what the fouling data say should happen2. The result is a sawtooth. The teeth are unevenly spaced because the sensor is degrading unevenly.
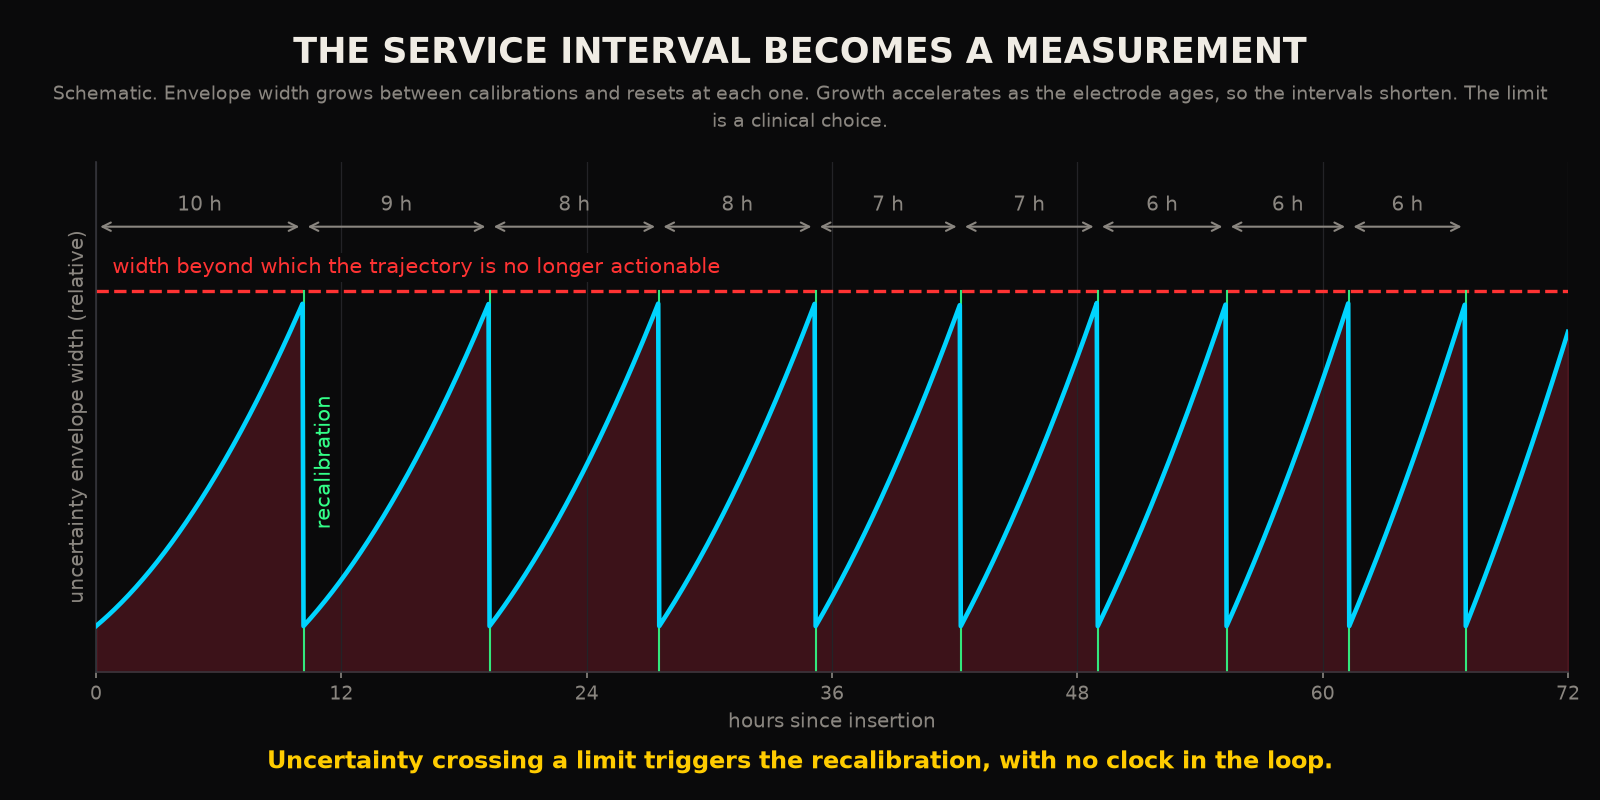
This is the point at which a measured quantity replaces an assumption. The service interval was a number somebody chose in a conference room. Now the sensor earns it, hour by hour. A sensor in a patient with a brisk inflammatory response will foul faster and be recalibrated sooner. One whose other channels keep agreeing with it will be left alone. The clock is gone from the loop. The uncertainty has taken its place.
5What this means
If you are building a continuous chemistry channel for blood, the design consequence is blunt. The sensor will foul. The coating will delay it and will not prevent it. The honest engineering question is what the estimator does on the way down. If the answer is a constant measurement noise measured on the bench, the system will produce confident wrong numbers in the hours when the patient is sickest and the sensor is oldest, and it will do so quietly. If the answer is a reliability index that scales the noise, the system will produce wider bands, fewer surprises, and a maintenance schedule that the physiology sets.
If you are reading a continuous trace at the bedside, the consequence is a question to ask of every number on the screen: how wide is the band, and why? A trace that never widens is either a perfect sensor or a filter that has not been told how to doubt. There has only ever been one of those.
A sensor that admits what it does not know is more useful than a sensor that is sure. The mathematics to make it admit that has been in print since Kalman's paper in 1960.
RReferences
- 1.Cha KH, Wang X, Meyerhoff ME. Nitric oxide release for improving performance of implantable chemical sensors: a review. Appl Mater Today. 2017;9:589-597.
- 2.Ren H, Coughlin MA, Major TC, et al. Improved in vivo performance of amperometric oxygen (PO2) sensing catheters via electrochemical nitric oxide generation/release. Anal Chem. 2015;87(16):8067-8072.
- 3.Ganter M, Zollinger A. Continuous intravascular blood gas monitoring: development, current techniques, and clinical use of a commercial device. Br J Anaesth. 2003;91(3):397-407.
- 4.Southworth R, Sutton R, Mize S, et al. Clinical evaluation of a new in-line continuous blood gas monitor. J Extra Corpor Technol. 1998;30(4):166-170.
- 5.Bellaiche AL, Nielsen PF, Brantlov S, Møller MB, Winterdahl M. Clinical evaluation of the accuracy and precision of the CDI 500 in-line blood gas monitor with and without gas calibration. J Extra Corpor Technol. 2011;43(2):53-57.
- 6.Wadwa RP, Laffel LM, Shah VN, Garg SK. Accuracy of a factory-calibrated, real-time continuous glucose monitoring system during 10 days of use in youth and adults with diabetes. Diabetes Technol Ther. 2018;20(6):395-402.
- 7.Shah VN, Laffel LM, Wadwa RP, Garg SK. Performance of a factory-calibrated real-time continuous glucose monitoring system utilizing an automated sensor applicator. Diabetes Technol Ther. 2018;20(6):428-433.
- 8.Welsh JB, Zhang X, Puhr SA, et al. Performance of a factory-calibrated, real-time continuous glucose monitoring system in pediatric participants with type 1 diabetes. J Diabetes Sci Technol. 2019;13(2):254-258.
- 9.Welch G, Bishop G. An introduction to the Kalman filter. Technical Report TR 95-041, Department of Computer Science, University of North Carolina at Chapel Hill; updated 2004.
- 10.Akhlaghi S, Zhou N, Huang Z. Adaptive adjustment of noise covariance in Kalman filter for dynamic state estimation. arXiv:1702.00884 [cs.SY]; 2017.
- 11.Li Q, Mark RG, Clifford GD. Robust heart rate estimation from multiple asynchronous noisy sources using signal quality indices and a Kalman filter. Physiol Meas. 2008;29(1):15-32.
- 12.Kunche N. The Kunche Adaptive Estimator: a reliability adaptive Kalman filtering framework for autonomous multi-biomarker state estimation in critical care monitoring. Authorea preprint; 2025. Not peer reviewed.
Declarations
Competing interests. The author is the founder of Aethryva Deeptech, which develops the tachyDx platform and the MOISSCode language. Where an article in this series mentions either, it says so in the text and the mention follows the argument.
Sources and figures. Every reference in this article is an open access source that any reader can open without payment. The figures were drawn by the author from the values printed in those sources, or are labelled as schematic where no published value exists. No patient data were used.
Cite this article
Kunche N. When a sensor drifts, an honest filter widens its error bars. The Intervention. 9 July 2026. https://nikhilkunche.com/blog/when-a-sensor-drifts-an-honest-filter-widens-its-error-bars
Comments