
It is day three of vancomycin and piperacillin-tazobactam. The cultures have grown a sensitive organism, the procalcitonin has halved since admission, the fever is gone, and the morning round moves through bed four in under two minutes because there is nothing to argue about. The infection is being won.
On the nursing flow sheet, in the column that records hourly urine output, the numbers have been getting smaller since yesterday afternoon: 60, 55, 45, 40, 35, 30. The numbers have not been plotted. That column is never plotted. You have seen it, a list of integers on a page that is turned over at midnight. The creatinine on this morning's panel was 1.1, which is what it was yesterday. This is exactly why the round was quick.
Tomorrow's creatinine will be 1.9. Tomorrow the round will stop at bed four for twenty minutes. Somebody will say the word nephrotoxicity, the vancomycin will be held and a level sent, and the team will date the kidney injury to the morning they noticed it. The kidney will have been failing for a day and a half by then. The information that would have said so was on the flow sheet the whole time.
1The combination that takes the kidneys
This particular collision is the most studied one in the unit, because it is so common. Vancomycin covers the resistant Gram positive and piperacillin-tazobactam covers everything else, so both get started together in the emergency department before anything has grown. In a cohort of critically ill patients at a single American centre, acute kidney injury developed in 39.3 percent of those on vancomycin with piperacillin-tazobactam, against 24.2 percent with cefepime and 23.5 percent with meropenem1. Stage two or three injury followed in 15 percent of the combination group. After adjustment the odds ratio for the combination was 2.161. A pooled analysis of twelve observational studies and 14,511 patients put the odds of injury at 2.31 times higher with piperacillin-tazobactam than with meropenem alongside vancomycin2. A 2025 meta analysis confined to the critically ill, twenty studies and 28,243 patients, found an odds ratio of 1.66 for any injury and 1.63 for stage two to three injury3. It found no difference in mortality, dialysis, or time to injury between the regimens3.
There is an honest caveat, and it belongs in the body of the post (a footnote would hide it). A prospective cohort measured cystatin C alongside creatinine. The combination was associated with creatinine defined injury and with no change in cystatin C or the other alternative markers4. The authors read that as support for the hypothesis that some of the creatinine rise is pseudotoxicity, a drug effect on how the kidney handles creatinine and on the assay, with no loss of filtration4. That does not rescue the patient in bed four, because the team is going to act on the creatinine whichever mechanism produced it. It does mean that the number the team is waiting for is both late and ambiguous. That is a poor combination of properties for a trigger.
2Every rescue has a bill
The antibiotic case is the clearest, and it is one of a family. Almost every intervention in the unit saves one organ while charging another. The charge is discovered later, on a different page.
Fluid resuscitation is the obvious second example. The CLOVERS trial gave 1,563 patients with sepsis induced hypotension either a restrictive or a liberal early fluid strategy5. The restrictive group received about 2.1 litres less, used vasopressors earlier and for longer, and died at the same rate, 14.0 percent against 14.9 percent5. The fluid itself is where the bill arrives. In 173 consecutive septic patients followed for a week, the daily fluid balance of those who died was more than twice that of those who survived, 29 against 13 mL per kilogram6. A positive balance was independently associated with death at a hazard of 1.014 per mL per kilogram6. In a propensity matched cohort of 2,516 septic patients across twenty Korean hospitals, a positive balance on the first ICU day made no difference to 28 day mortality. A positive balance on the second day doubled the hazard. On the third day it raised the hazard by half7. The best trial evidence that the resuscitation fluid can itself raise mortality comes from children. In the FEAST trial, a saline or albumin bolus raised 48 hour mortality to 10.5 and 10.6 percent against 7.3 percent with no bolus, a relative risk of 1.458. The rate of pulmonary oedema was no different between the arms, so the mechanism was something other than the one everyone would have charted8.
Sedation charges the brain. In surgical and trauma ICU patients the prevalence of delirium was 73 and 67 percent, and midazolam exposure carried an odds ratio of 2.75 for developing it9. The charge is then missed. In a Dutch ICU where delirium occurred in half of patients, the bedside doctors recognised 28 percent of the delirious days and the nurses 35 percent, each with near perfect specificity10. That is the signature of a harm that is invisible until someone looks for it with a tool. When units run the full ABCDEF bundle, which is mostly a discipline of looking, delirium falls by 40 percent and death within seven days by two thirds11. Vasopressors charge the gut and the fingers, in a dose dependent way that the case series describe and the trials mostly do not quantify. In VASST, at low vasopressin doses, serious adverse events were no more frequent than with norepinephrine, 10.3 against 10.5 percent12. That is the counterweight to the folklore. It is also a reminder that the bill depends on the dose, which is on yet another chart.
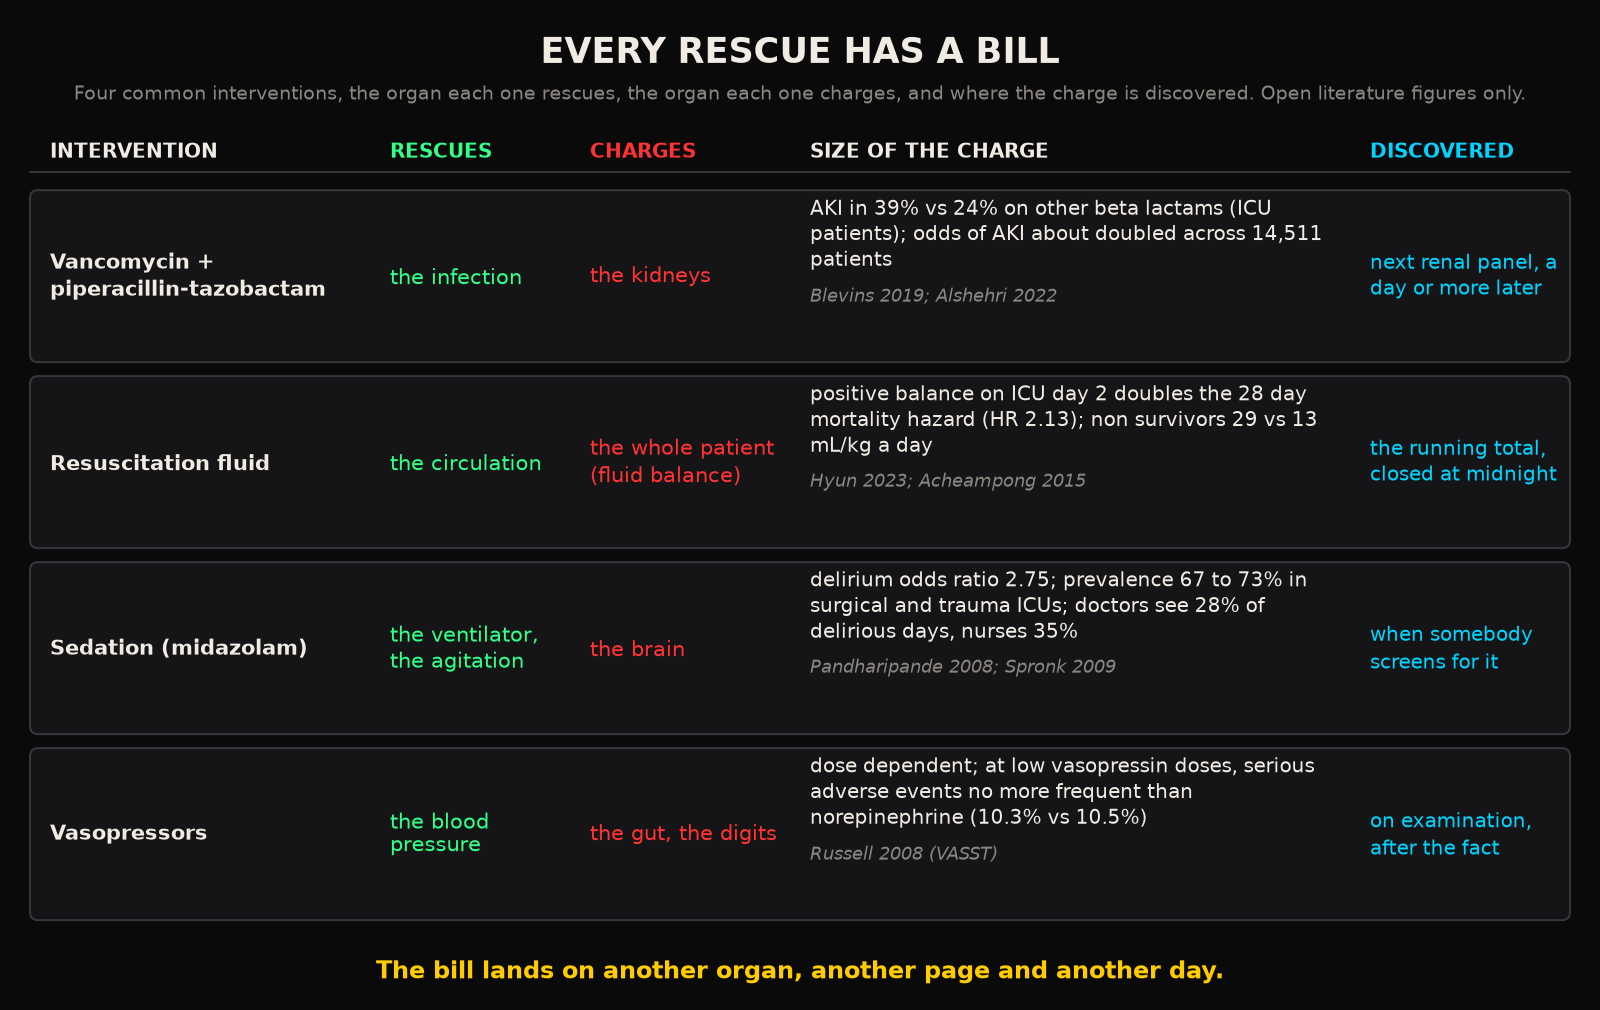
The pattern across all four rows is the same. The benefit is the reason the intervention was started, so it is watched. The problem is that the harm is a side effect on an organ that belongs to a different specialty, a different page of the chart and a different laboratory test. So it is found when that test is next drawn. A trigger tool review of 960 records at a Swedish university hospital found 33 adverse events per 1,000 patient days, affecting a fifth of patients and adding five days to their stay17. The voluntary reporting system had captured 6.3 percent of them17. In a Paris medical ICU, 23 percent of admissions were caused by an adverse drug event, and 59 percent of those were judged preventable18. Harm that compounds for a day before anyone sees it is the normal condition of the unit. The vancomycin case is the version of it that happens to have a pooled estimate.
3Why you find out tomorrow
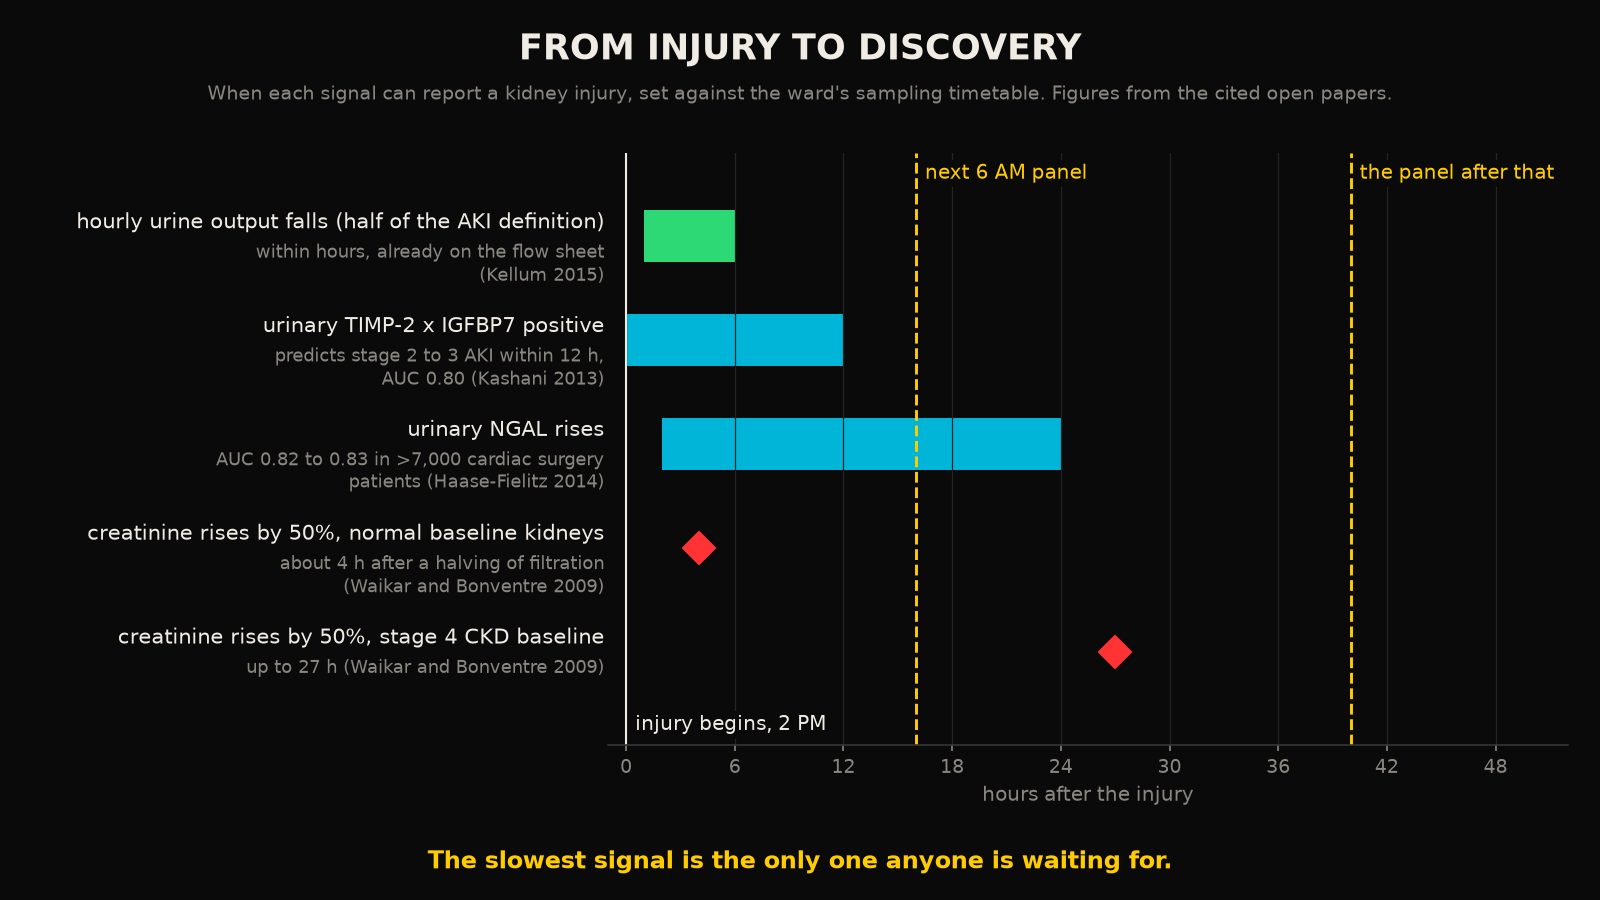
The delay is physiology plus a timetable. Creatinine is a product of muscle that accumulates slowly when filtration stops. Basically it is a lagging integral of the injury. The kinetics have been worked out. After a sudden halving of filtration, the time for creatinine to rise by 50 percent runs from about four hours in a patient with normal baseline kidneys to 27 hours in a patient with stage four chronic kidney disease13. The time to rise by an absolute 0.5 mg/dL is nearly the same across baselines after a moderate to severe injury13. On top of that lag sits the ward's sampling interval. If the injury began at two in the afternoon and the panel is drawn at six in the morning, the earliest the creatinine can say anything is the following day. If the rise is still small at that draw, it is the day after.
The signals that move earlier are already in the building. Urine output is an hourly measurement, and it is the other half of the AKI definition. Across 32,045 critically ill patients, injury defined by either criterion developed in 74.5 percent14. When both the urine output and the creatinine criteria reached stage three, hospital mortality rose from 4.3 percent in patients with no injury to 51.1 percent, with dialysis rising from zero to 55 percent14. Urine output is also the criterion that is sitting on the flow sheet in bed four, in integers that are never plotted. The urinary cell cycle arrest markers TIMP-2 and IGFBP7 together predicted stage two to three injury within the next twelve hours with an area under the curve of 0.80 in the discovery and validation cohorts, where no existing marker reached 0.7215. Neutrophil gelatinase associated lipocalin predicted injury and its severity with an area under the curve of 0.82 to 0.83 across more than 7,000 cardiac surgery patients and similar figures in 8,500 critically ill patients16. These are assays with their own costs and their own limits. This post is making no claim that any unit should run them. The point is narrower. The information that the kidney is in trouble exists hours to a day before the creatinine reports it, some of it in a free hourly measurement. The system is organised so that the late, ambiguous signal is the one that triggers the decision.
4The organs are coupled and the sheets are not
Here is the part of the delay that has nothing to do with creatinine. The infection lives on the microbiology page and the procalcitonin trend. The kidney lives on the renal panel. Its hourly form is on the nursing flow sheet. The antibiotic lives on the drug chart, with its doses and its levels. The fluid balance is a running total on a fourth sheet that is closed at midnight (as if the kidney also closed at midnight). In most Indian ICUs these are four physical documents or four tabs of an EMR that was designed around billing. The one place they are integrated is your head, for the two minutes the round stands at the bed.
Coupled systems cannot be read one variable at a time. The thing that would have stopped the round at bed four on day three is a picture of three slopes together: procalcitonin falling, urine output falling, the cumulative dose of the two drugs rising. Any one of those lines is unremarkable. The three of them on one clock are a collision in progress. A junior doctor who has never heard the word pseudotoxicity would see it, because people are good at seeing two lines converge. What you cannot do is hold three slopes from three pages in working memory while answering a phone. Is there a reason, beyond habit, that the organs are coupled and the chart is not?
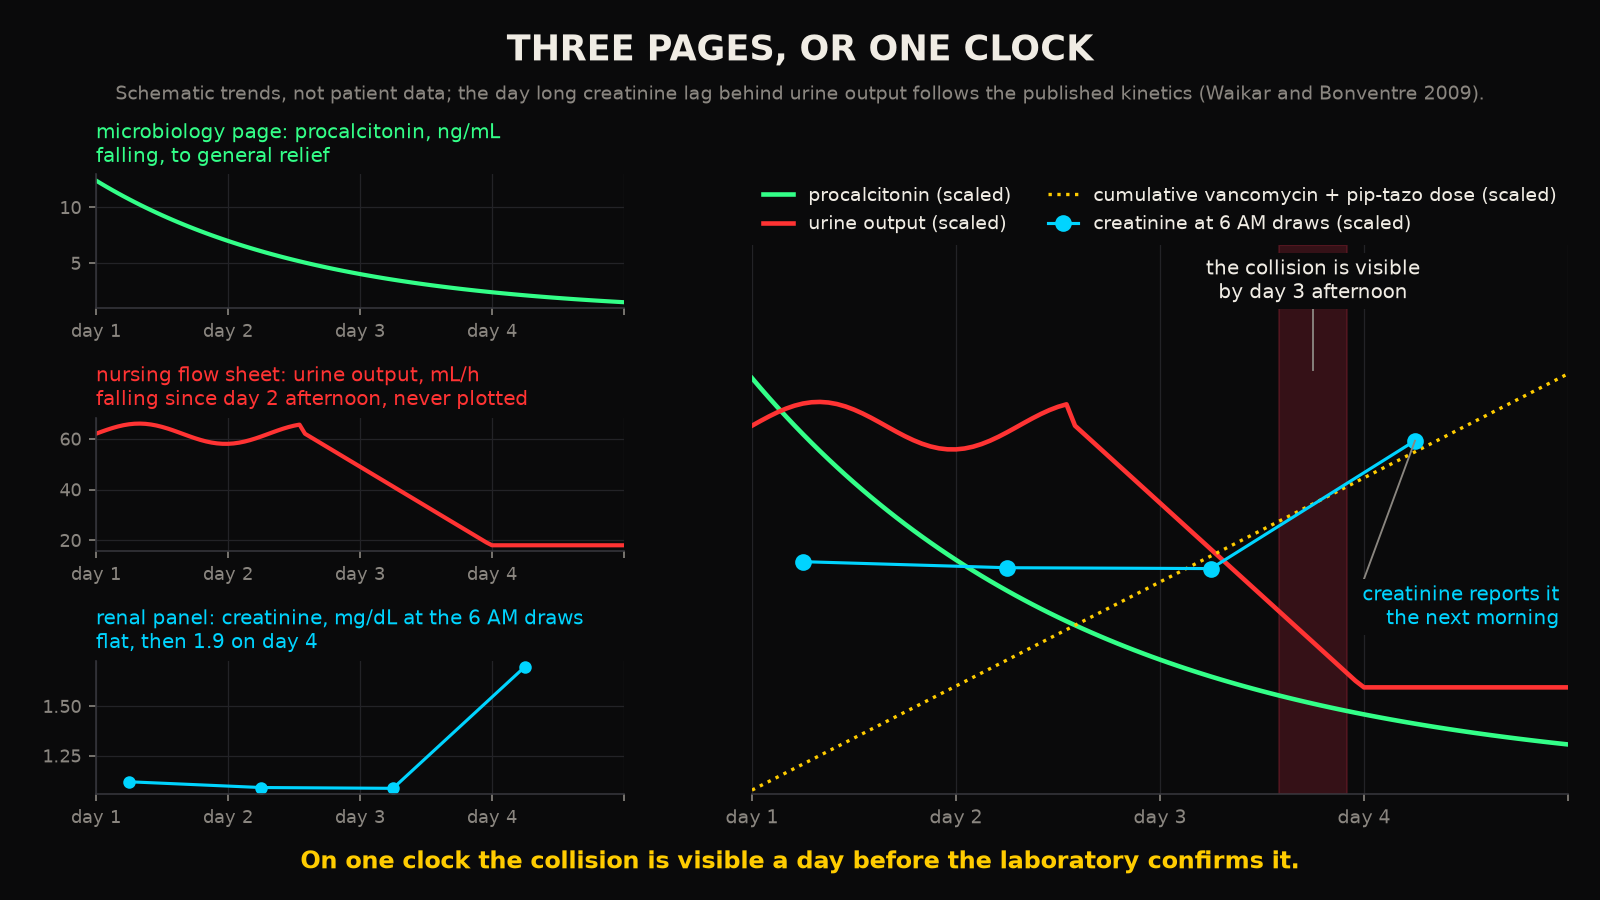
This is the piece of the problem that was built against. In tachyDx Teams, the drug administration record, the fluid balance and the laboratory trends are one chart with one clock. The pharmacist role sees the orders against the trends, so the person whose job is to catch the vancomycin and piperacillin-tazobactam pair is looking at the urine output when they do it. The hourly integers from the flow sheet become a line. The collision becomes visible on the afternoon it starts, on the phone of whoever is on. An intensivist has been running it on her own phone since July. What it does not do is predict, because seeing two slopes converge is still a human judgement, and computing when they will collide, with an honest error bar, is the open problem that the rest of this series is about.
5What this means
For the unit, the implication costs nothing. The hourly urine output is a trend, so plot it on the same axis as the drugs that can take the kidneys. Read the drug chart against the kidney every time a nephrotoxic pair is on it. For anyone designing the surface a clinician looks at, the implication is a constraint: no organ gets its own page. The benefit and the bill of every intervention have to be visible in the same frame, because the frame is the only place the collision exists before the laboratory confirms it.
Back in bed four the procalcitonin is still falling. The urine output is 25 now. The next panel goes at six.
You will find out tomorrow, and by then the information will be worth nothing.
RReferences
- 1.Blevins AM, Lashinsky JN, McCammon C, Kollef M, Micek S, Juang P. Incidence of acute kidney injury in critically ill patients receiving vancomycin with concomitant piperacillin-tazobactam, cefepime, or meropenem. Antimicrob Agents Chemother. 2019;63(5):e02658-18.
- 2.Alshehri AM, Alzahrani MY, Abujamal MA, et al. Comparative risk of acute kidney injury following concurrent administration of vancomycin with piperacillin/tazobactam or meropenem: a systematic review and meta-analysis of observational studies. Antibiotics (Basel). 2022;11(4):526.
- 3.Li R, Li Y, Xu C, et al. Incidence of acute kidney injury in critically ill patients receiving vancomycin with concomitant piperacillin-tazobactam versus other beta-lactams: a systematic review and meta-analysis. J Pharm Technol. 2025;41(6):291-302.
- 4.Miano TA, Hennessy S, Yang W, et al. Association of vancomycin plus piperacillin-tazobactam with early changes in creatinine versus cystatin C in critically ill adults: a prospective cohort study. Intensive Care Med. 2022;48(9):1144-1155.
- 5.Shapiro NI, Douglas IS, Brower RG, et al.; NHLBI PETAL Clinical Trials Network. Early restrictive or liberal fluid management for sepsis-induced hypotension (CLOVERS). N Engl J Med. 2023;388(6):499-510. Author manuscript in PMC.
- 6.Acheampong A, Vincent JL. A positive fluid balance is an independent prognostic factor in patients with sepsis. Crit Care. 2015;19:251.
- 7.Hyun DG, Ahn JH, Huh JW, et al.; Korean Sepsis Alliance investigators. Impact of a cumulative positive fluid balance during the first three ICU days in patients with sepsis: a propensity score-matched cohort study. Ann Intensive Care. 2023;13(1):105.
- 8.Maitland K, Kiguli S, Opoka RO, et al.; FEAST Trial Group. Mortality after fluid bolus in African children with severe infection. N Engl J Med. 2011;364(26):2483-2495.
- 9.Pandharipande P, Cotton BA, Shintani A, et al. Prevalence and risk factors for development of delirium in surgical and trauma intensive care unit patients. J Trauma. 2008;65(1):34-41.
- 10.Spronk PE, Riekerk B, Hofhuis J, Rommes JH. Occurrence of delirium is severely underestimated in the ICU during daily care. Intensive Care Med. 2009;35(7):1276-1280.
- 11.Pun BT, Balas MC, Barnes-Daly MA, et al. Caring for critically ill patients with the ABCDEF bundle: results of the ICU Liberation Collaborative in over 15,000 adults. Crit Care Med. 2019;47(1):3-14.
- 12.Russell JA, Walley KR, Singer J, et al.; VASST Investigators. Vasopressin versus norepinephrine infusion in patients with septic shock. N Engl J Med. 2008;358(9):877-887.
- 13.Waikar SS, Bonventre JV. Creatinine kinetics and the definition of acute kidney injury. J Am Soc Nephrol. 2009;20(3):672-679.
- 14.Kellum JA, Sileanu FE, Murugan R, Lucko N, Shaw AD, Clermont G. Classifying AKI by urine output versus serum creatinine level. J Am Soc Nephrol. 2015;26(9):2231-2238.
- 15.Kashani K, Al-Khafaji A, Ardiles T, et al. Discovery and validation of cell cycle arrest biomarkers in human acute kidney injury. Crit Care. 2013;17(1):R25.
- 16.Haase-Fielitz A, Haase M, Devarajan P. Neutrophil gelatinase-associated lipocalin as a biomarker of acute kidney injury: a critical evaluation of current status. Ann Clin Biochem. 2014;51(Pt 3):335-351.
- 17.Rutberg H, Borgstedt Risberg M, Sjödahl R, Nordqvist P, Valter L, Nilsson L. Characterisations of adverse events detected in a university hospital: a 4-year study using the Global Trigger Tool method. BMJ Open. 2014;4(5):e004879.
- 18.Jolivot PA, Pichereau C, Hindlet P, et al. An observational study of adult admissions to a medical ICU due to adverse drug events. Ann Intensive Care. 2016;6(1):9.
Declarations
Competing interests. The author is the founder of Aethryva Deeptech, which develops the tachyDx platform and the MOISSCode language. Where an article in this series mentions either, it says so in the text and the mention follows the argument.
Sources and figures. Every reference in this article is an open access source that any reader can open without payment. The figures were drawn by the author from the values printed in those sources, or are labelled as schematic where no published value exists. No patient data were used.
Cite this article
Kunche N. Serum creatinine reports antibiotic kidney injury about a day late. The Intervention. 23 July 2026. https://nikhilkunche.com/blog/serum-creatinine-reports-antibiotic-kidney-injury-about-a-day-late
Comments