
A postdoctoral researcher is three weeks into a project on crystalloid resuscitation and she has a result. The question is whether a litre of balanced fluid moves serum sodium in the first hours of septic shock. She is working in MIMIC-IV, which holds tens of thousands of ICU admissions from one Boston hospital with every laboratory value time stamped1. She takes the last sodium before the bolus and the first sodium after it. The rise is about three mmol/L, the confidence interval is tight, and it holds across subgroups. The paper is already outlining itself.
Look at where the two numbers came from. The sodium before the bolus came from the morning chemistry panel, drawn by the phlebotomy round and run in the central laboratory. The sodium after it came from an arterial blood gas, drawn at the bedside during the resuscitation and run on the analyser in the corner of the unit. Her query did not distinguish them. She pulled every row labelled sodium and let the timestamps sort it out. The three mmol/L she is about to publish is close to the published offset between those two instruments. The dataset is never going to tell her that.
1Two identifiers for one ion
You have probably run the same query. MIMIC-IV stores laboratory results in a single long table, and each kind of measurement carries a numeric identifier, the itemid. The official concept code that the maintainers publish for building a blood gas table lists its own identifiers: 50824 for sodium, 50806 for chloride, 50809 for glucose, 50810 for haematocrit, 50822 for potassium, and 50804 for calculated total CO22. The concept code for the chemistry panel lists a second, entirely separate set: 50983 for sodium, 50902 for chloride, 50931 for glucose, 50971 for potassium, 50882 for bicarbonate3. The full blood count carries a third haematocrit, 51221, from the haematology analyser4. Each row in the maintainers' file carries a comment giving its row count (the counts are sitting in the SQL, in plain sight). The chemistry sodium alone has over eight hundred thousand rows3.
So a single patient on a single day is carrying two sodiums, two glucoses, two chlorides and three haematocrits. The table treats them as unrelated measurements that happen to share a name in the label column. This is faithful to how the hospital works. The blood gas analyser measures sodium on whole blood with a direct ion selective electrode, within minutes, at the bedside. The chemistry analyser measures it on separated plasma, diluted, on an indirect electrode, in a central laboratory, on a different calibration. Basically you have two chemistries reading one ion. They will never agree exactly.
How far apart are they? That has been measured prospectively in critically ill patients, with paired samples from the same syringe. In 314 arterial pairs from 51 ICU patients, the blood gas analyser read sodium 1.3 mmol/L higher than the central laboratory, with 95 percent limits of agreement from 2.2 below to 4.8 above5. Chloride read 0.9 lower, with limits from 3.7 below to 2.0 above. Glucose read 11 mg/dL lower, with limits from 30 below to 9 above. Haematocrit read 1.1 points lower, haemoglobin 0.8 g/dL lower, and bicarbonate 0.8 mmol/L higher5. In a Turkish ICU running both instruments in routine practice, the blood gas sodium averaged 138.1 mmol/L against 143.0 on the autoanalyser. The authors concluded that the two instruments do not yield equivalent sodium or potassium data6. Across 224,383 paired samples from 65,042 patients in a multicentre Australian cohort, the mean difference for sodium was only 0.72 mmol/L. The limits of agreement were 4.35 mmol/L wide. In patients with severe hyperglycaemia the mean gap opened to 1.85 mmol/L in the other direction7.
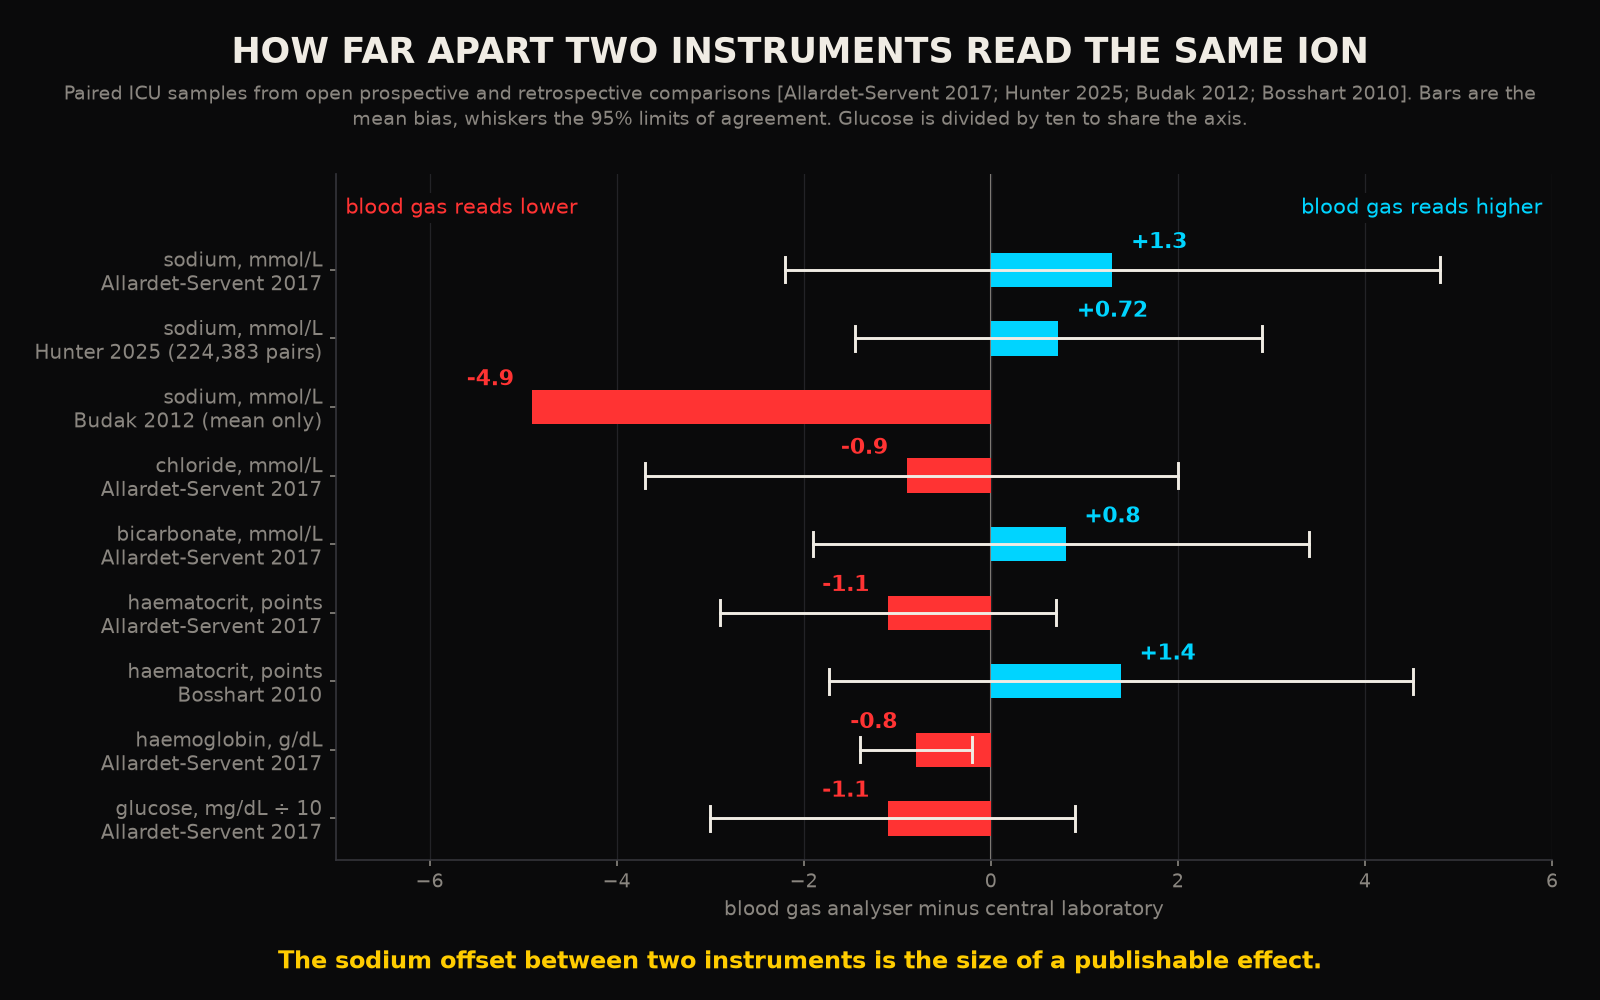
Notice the signs. In the French cohort the blood gas sodium read higher than the laboratory. In the Turkish cohort it read almost five lower. The direction depends on the analyser pair, the protein and lipid content of the plasma, and the population12. A study across 9,398 pairs found glucose to be the analyte most often outside the regulatory limits for agreement, at 7.1 percent of pairs. In the same study sodium had the widest limits of agreement relative to its bias8. In a 2026 series of patients with acute kidney injury the chloride bias reached 7.18 mmol/L11. Haematocrit is worse, because the blood gas analyser infers it from conductivity while the haematology analyser counts cells. A bias of 1.39 points with limits of plus or minus 3.12 was enough that 22.7 percent of transfusion decisions would have gone the other way depending on which number was read9. Haemoglobin on the blood gas analyser reads low by an amount that depends on the model, 0.38 g/dL on two common analysers and 0.09 g/dL on a third10.
None of this is scandalous. Every laboratory director knows it. You have compared the gas sodium with the morning panel yourself and shrugged at a difference of three. The scandal, if there is one, is downstream, where the two columns are merged by people who were never told there were two.
2The gas is drawn when something is happening
If the offset were random with respect to the patient, mixing sources would add noise and nothing else. A large enough cohort would wash it out. The problem is that the offset is anything but random with respect to the patient. A blood gas is drawn when there is an arterial line to draw it from, when the patient is ventilated, when the lactate is being chased, when the nurse is worried. In a Geneva surgical ICU the rate was 8.2 gases per patient per day before a guideline and feedback programme and 4.8 after it15. The density of the blood gas channel is set by practice and attention. It can be halved by a memo. In an Indian ICU audit, 985 gases were drawn on 173 patients in two months, 80 percent of them as routine with no specific indication, and 26 percent of them changed management16. Across Japanese ICUs the adjusted ratio of observed to expected gas use ranged from 0.73 in the lowest tertile of units to 1.15 in the highest17. The blood gas channel is dense whenever a patient is being watched. The patient is being watched because of their state.
This is a special case of a general result that the EHR research community has already published and mostly ignored. In 669,452 patients across two hospitals, whether a laboratory test was ordered at all carried a significant association with survival for 86 percent of 272 tests13. For 68 percent of those tests the timing features of the order predicted survival better than the value did13. In MIMIC-III specifically, when models were built to predict mortality, more than 40 percent of the predictors that feature selection kept were indicators of whether a value was missing14. The act of measuring is itself a signal about the patient. A switch from one instrument to another is a change in the act of measuring.
Put the two facts together. The source switch carries an offset of a few units. It happens at the moment of clinical change. An analysis that compares a pre value from one source to a post value from the other will find a step at every event, in whichever direction the local analyser pair points. That step will be reproducible, well powered and consistent across subgroups, because it is a property of the hospital's workflow and the workflow is consistent. This is exactly why the researcher's confidence interval is tight. The artefact does not fail loudly. What it produces is a clean result.
3What the mixed series looks like
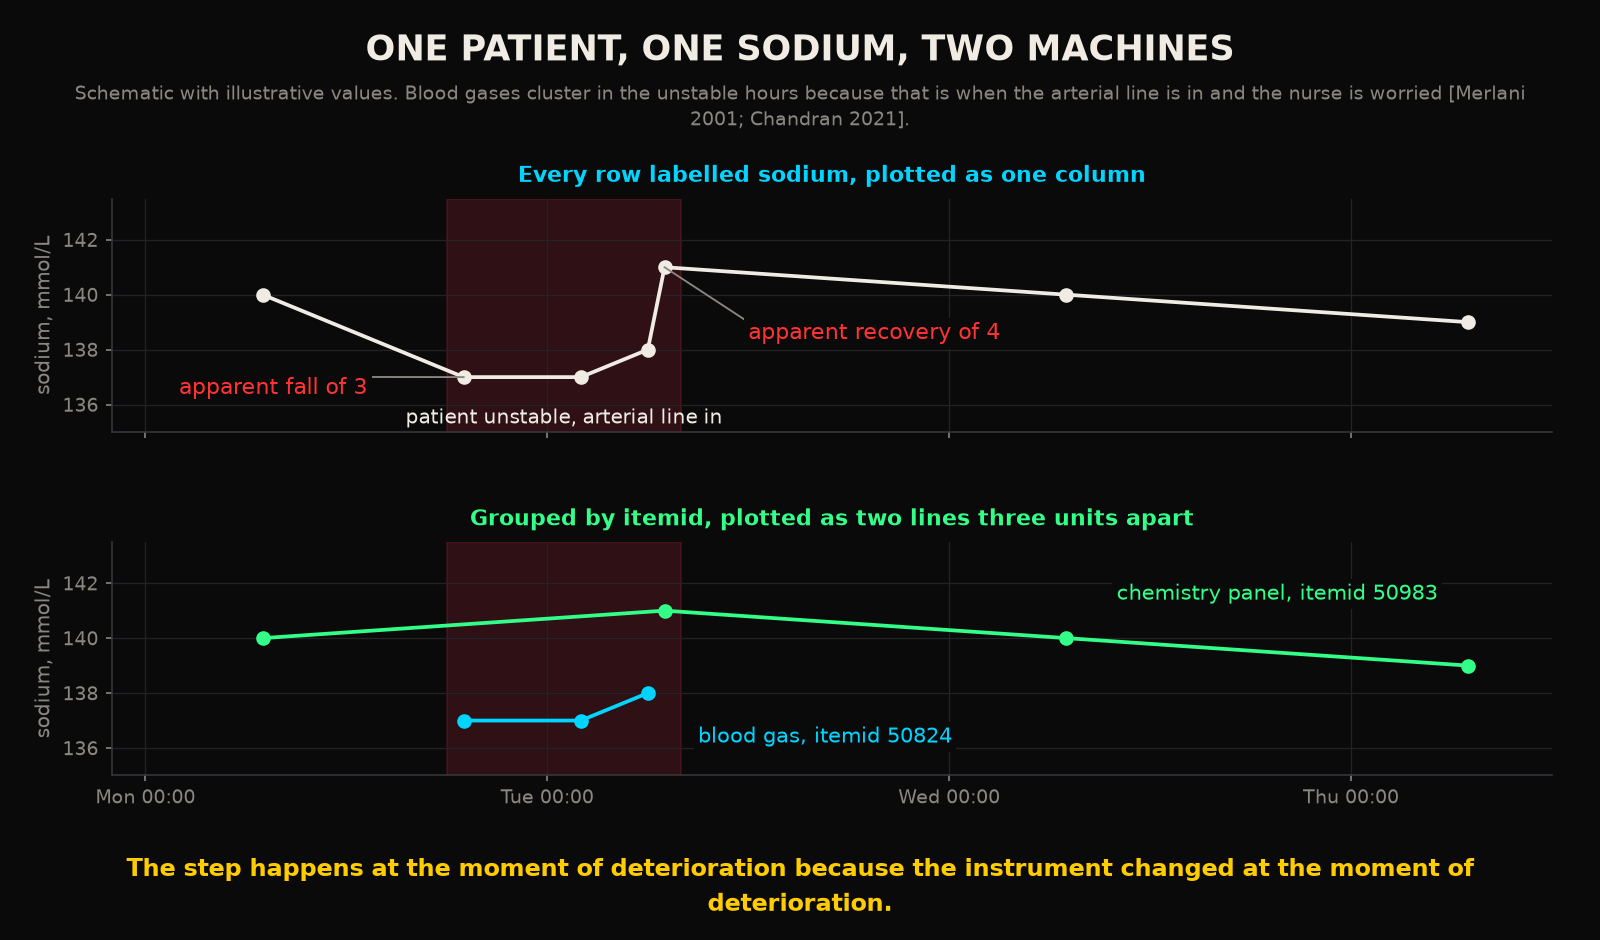
Walk through the researcher's patient. Monday morning the chemistry panel reads 140. Monday evening the patient becomes hypotensive, an arterial line goes in, and the first gas reads 137. Tuesday at 2 AM a second gas reads 137. At 6 AM a third reads 138. At 7 AM the morning panel, drawn from the same line in the same hour, reads 141. Over the next two days the patient settles, the line comes out, and the chemistry panel reads 140, 140, 139. In a single column labelled sodium this is a fall of three at the onset of shock, a recovery of four over the next five hours, and a plateau. In two columns it is a laboratory line sitting at 140 and a gas line sitting at 137, each flat to within a unit. The patient's sodium has done nothing at all.
Now imagine the analysis is a model. The features are the most recent sodium, the change in sodium over six hours, the sodium slope. The label is deterioration in the next twelve hours. The model learns that a sudden three unit drop in sodium predicts deterioration. In the held out set the association holds, because in the held out set the same unit drew the same gases on the same kind of patient. The validation is honest and the finding is false. It would also survive external validation in any hospital where the analyser pair happens to point the same way. In a hospital where the pair points the other way it would fail silently (this is a plausible explanation for some of the replication failures that get blamed on case mix). One qualification is owed here. The comparisons above come from other hospitals and other analyser pairs, so the exact size and sign of the offset inside MIMIC is something these papers cannot give you.
4The test that catches it
The fix is dull and it has two parts. The first is a rule. Inside any single trajectory, hold the itemid constant. Pre and post values come from the same source, or the comparison is not made. A sodium change is computed between 50983 and 50983, or between 50824 and 50824, never across them. The same applies to glucose, chloride, potassium and haematocrit, where the three sources need three separate series. This throws away data. It is still the right thing to do.
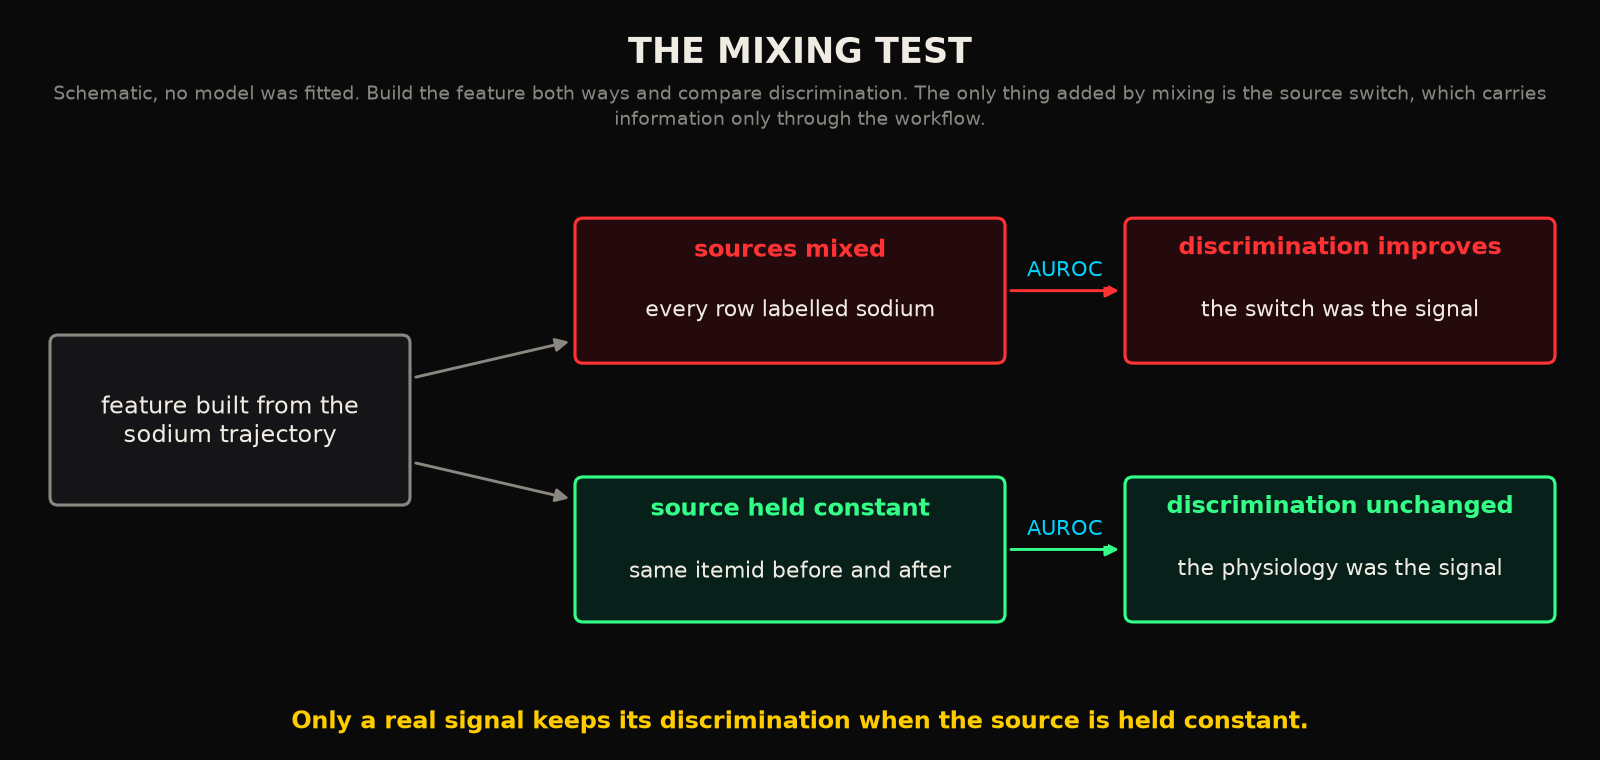
The second part is a falsification test, and you should run it even if you think your own pipeline is clean. Build the feature both ways, source controlled and source mixed, and compare discrimination. If the model gets better when sources are allowed to mix, the improvement is coming from the switch. The switch is the only thing you added. It carries information only through the workflow. A feature that is physiologically real will discriminate equally well with the source held constant. A feature that is an artefact of two instruments will lose its power the moment the instruments are separated. Which of your published effects would survive that?
5What a continuous path cannot do
The deeper point is about where the confound lives. The patient's sodium did nothing. MIMIC-IV recorded exactly what the hospital did. So the confound lives in the workflow: intermittent measurement, by more than one instrument, with the choice of instrument tied to the patient's state. Any dataset generated by that workflow will carry it. Every retrospective study on such a dataset has to defend itself against the confound, usually without knowing it needs to.
A single continuous sensing path cannot switch panels in the middle of a trajectory. What I mean by that is one channel reading one analyte through one chemistry produces a series that can only change because the patient changed. The path has other faults, and the earlier posts in this series have been honest about drift and error bars. The source confound is still an argument for continuous measurement that holds on its own, before any claim about speed or blood volume. It is an argument about the data, made before anyone reaches the bedside. The intermittent, multi instrument workflow is manufacturing effects at exactly the moments it is supposed to be observing them. It has been doing so in every ICU database ever assembled.
The researcher's finding will survive peer review, because the reviewers are using the same column. It will not survive a query that groups by itemid. The dataset is reporting the hospital faithfully. What it is telling her is which machine was nearest when the patient got sick.
RReferences
- 1.Johnson AEW, Bulgarelli L, Shen L, et al. MIMIC-IV, a freely accessible electronic health record dataset. Sci Data. 2023;10:1.
- 2.MIT Laboratory for Computational Physiology. mimic-code repository, mimic-iv/concepts/measurement/bg.sql. Blood gas itemids 50804, 50806, 50809, 50810, 50813, 50818, 50820, 50821, 50822, 50824.
- 3.MIT Laboratory for Computational Physiology. mimic-code repository, mimic-iv/concepts/measurement/chemistry.sql. Chemistry itemids 50882, 50902, 50931, 50971, 50983.
- 4.MIT Laboratory for Computational Physiology. mimic-code repository, mimic-iv/concepts/measurement/complete_blood_count.sql. Haematocrit itemid 51221.
- 5.Allardet-Servent J, Lebsir M, Dubroca C, et al. Point-of-care versus central laboratory measurements of hemoglobin, hematocrit, glucose, bicarbonate and electrolytes: a prospective observational study in critically ill patients. PLoS One. 2017;12(1):e0169593.
- 6.Budak YU, Huysal K, Polat M. Use of a blood gas analyzer and a laboratory autoanalyzer in routine practice to measure electrolytes in intensive care unit patients. BMC Anesthesiol. 2012;12:17.
- 7.Hunter K, Anstey C, Nesbitt A, et al. A comparison of sodium concentration measured in laboratory autoanalyser versus point-of-care blood gas machine: a retrospective, multicentre, analytical study in a large adult intensive care unit population. Crit Care Resusc. 2025;27(4):100149.
- 8.Prakash S, Bihari S, Lim ZY, Verghese S, Kulkarni H, Bersten AD. Concordance between point-of-care blood gas analysis and laboratory autoanalyzer in measurement of hemoglobin and electrolytes in critically ill patients. J Clin Lab Anal. 2018;32(6):e22425.
- 9.Bosshart M, Stover JF, Stocker R, et al. Two different hematocrit detection methods: different methods, different results? BMC Res Notes. 2010;3:65.
- 10.Tanner L, Lindau S, Velten M, et al. Factors influencing the bias between blood gas analysis versus central laboratory hemoglobin testing. A secondary analysis of a randomized controlled trial. PLoS One. 2020;15(10):e0240721.
- 11.Phongphithakchai A, Thingphom S, Tedasen A, et al. Agreement of electrolyte measurements between arterial blood gas analyzers and central laboratories in critically ill patients with acute kidney injury. Med Sci (Basel). 2026;14(3):383.
- 12.Jin S, Zhang X, Wang Y, et al. Comparison of electrolytes and hemoglobin testing between a blood gas analyzer and core lab analyzers. J Clin Lab Anal. 2026;40(1):e70141.
- 13.Agniel D, Kohane IS, Weber GM. Biases in electronic health record data due to processes within the healthcare system: retrospective observational study. BMJ. 2018;361:k1479.
- 14.Sharafoddini A, Dubin JA, Maslove DM, Lee J. A new insight into missing data in intensive care unit patient profiles: observational study. JMIR Med Inform. 2019;7(1):e11605.
- 15.Merlani P, Garnerin P, Diby M, Ferring M, Ricou B. Linking guideline to regular feedback to increase appropriate requests for clinical tests: blood gas analysis in intensive care. BMJ. 2001;323(7313):620-624.
- 16.Chandran J, D'Silva C, Sriram S, Krishna B. Clinical utility of arterial blood gas test in an intensive care unit: an observational study. Indian J Crit Care Med. 2021;25(2):172-175.
- 17.Yawata S, Uchino S, Yamashima S, et al. Association between ICU-level variation in arterial blood gas utilization and in-hospital mortality: a retrospective cohort study using the Japanese Intensive care PAtient Database registry. PLoS One. 2026;21(6):e0343186.
Declarations
Competing interests. The author is the founder of Aethryva Deeptech, which develops the tachyDx platform and the MOISSCode language. Where an article in this series mentions either, it says so in the text and the mention follows the argument.
Sources and figures. Every reference in this article is an open access source that any reader can open without payment. The figures were drawn by the author from the values printed in those sources, or are labelled as schematic where no published value exists. No patient data were used.
Cite this article
Kunche N. MIMIC's two sodium measurements disagree by a clinically meaningful amount. The Intervention. 11 June 2026. https://nikhilkunche.com/blog/mimics-two-sodium-measurements-disagree-by-a-clinically-meaningful-amount
Comments