
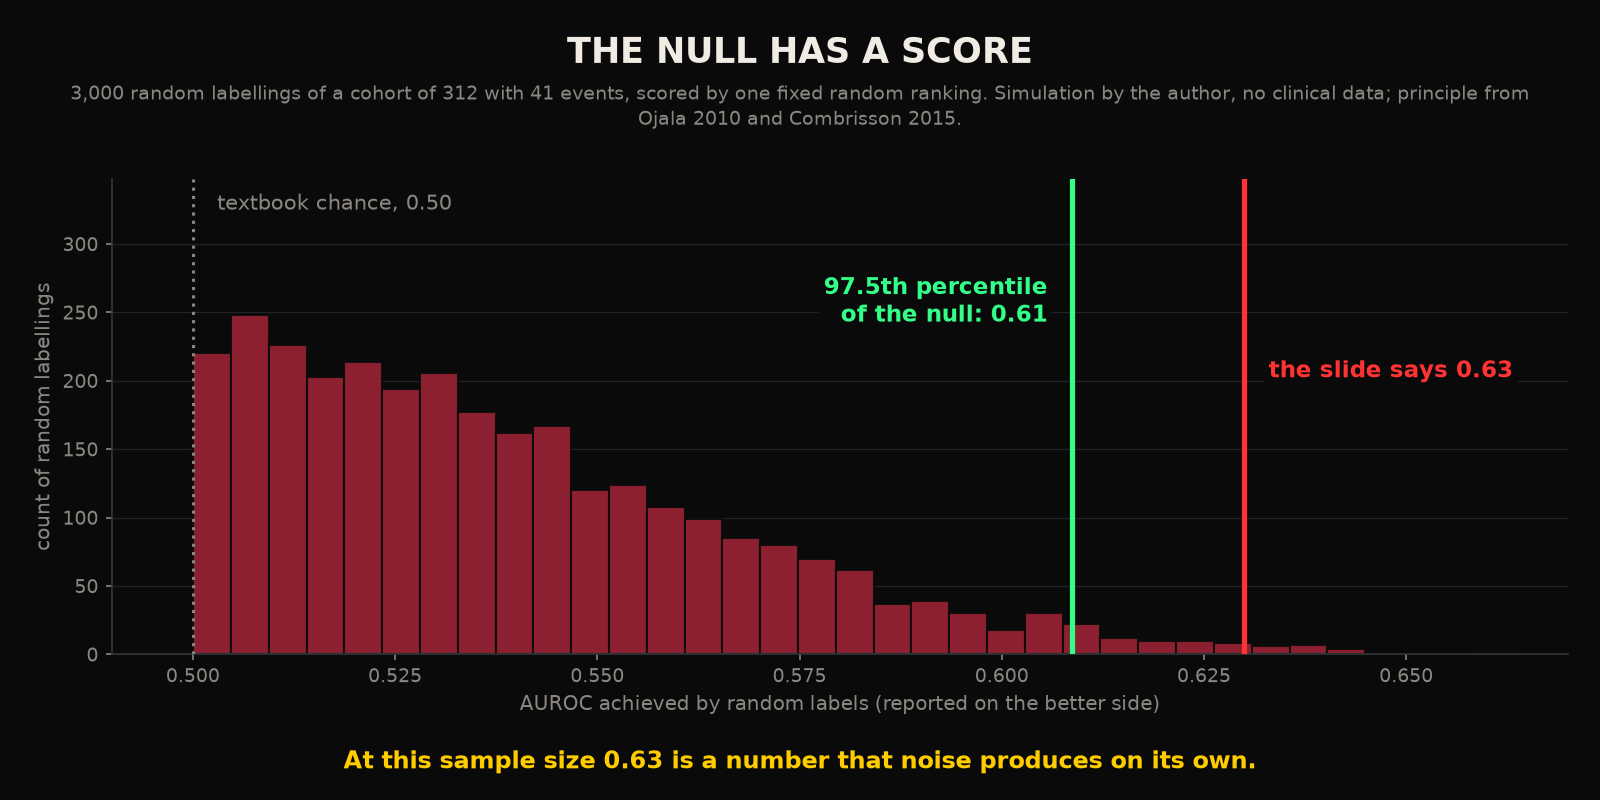
A research fellow has spent four months on it. Three hundred and twelve ICU admissions from the hospital's own database, forty one of them ending in the event he is trying to predict. The features come from the labs and the vitals, the model is a gradient boosted one, and the validation is five fold. The area under the curve comes out at 0.63. He puts it on a slide and the room is pleased, because 0.63 sits above 0.5 and everything above 0.5 reads as signal. Someone mentions that a widely deployed commercial sepsis model validated at exactly that number14, which the room takes as reassurance. The manuscript is drafted by the end of the month.
You have sat in that room. The one question that matters at that sample size has gone unasked. What AUROC would he have got if the forty one labels had been dealt out at random?
1Chance is a limit, and you are nowhere near it
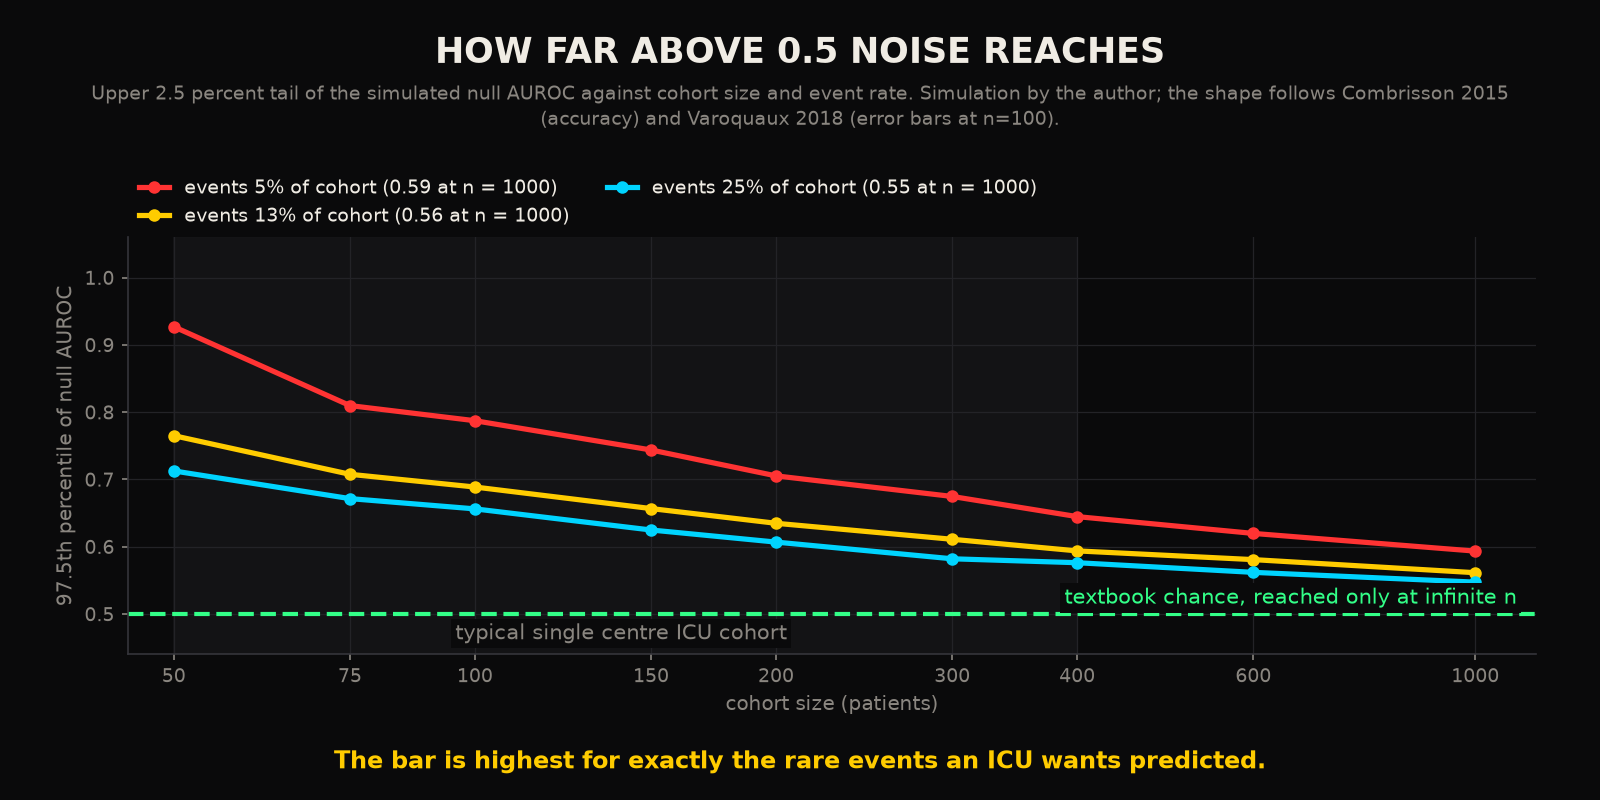
The number 0.5 is what a random classifier scores on a two class problem when the sample is infinite. That last clause is usually dropped. Dropping it is the whole mistake. Combrisson and Jerbi made the point with nothing more exotic than Gaussian noise. Classify random signals into two classes at the sample sizes typical of a brain decoding study and the classifier will reach 70 percent accuracy or higher, by chance, with some regularity1. The theoretical chance level of 50 percent for two classes, or 25 percent for four, is the value the distribution of random results converges on as the sample grows. At small n the distribution is wide. Its upper tail is where a research fellow finds his 0.63.
AUROC is a rank statistic. It is the probability that a randomly chosen patient who had the event is ranked above a randomly chosen patient who did not. That is a clean interpretation and you can read a tutorial on it in an afternoon6. The cleanliness hides the variance. With forty one events and two hundred and seventy one non events the statistic is built from a few thousand pairs. Those pairs are far from independent, because each event patient appears in two hundred and seventy one of them. Shuffle the forty one labels and recompute. The AUROC of pure noise will land at 0.55 routinely, at 0.58 often, and at 0.63 now and then. That is enough to make a point estimate on its own uninformative.
There is a right way to find out how often, and it has been in the machine learning literature for fifteen years. Permute the labels, run the entire pipeline on the permuted data, record the score, and repeat a thousand times (more if the tail is what you care about). What you get is the null distribution of the score for that cohort, that feature set, that fold structure2. Golland and Fischl set this out for small image studies in 2003, where the problem is identical, many features and few examples. They concluded that the significance of an observed accuracy could only be estimated this way3. Noirhomme and colleagues then showed what the shortcut costs. Cross validated accuracies from random data were tested against a binomial distribution, as most papers do, and three of sixteen patients in a brain computer interface study reached significance. Against a permutation null, one did4.
2The folds are worse than the sample
The sample size is only the first problem. The second is what the fellow did with it. His three hundred and twelve admissions are not three hundred and twelve independent things. An ICU patient generates many rows (a window every six hours, a lab panel every morning, a vital sign every minute). If the windows were split into folds at random, the same patient is sitting in the training fold and in the test fold. The model is then being rewarded for recognising the patient, which is a different skill from predicting the event. It is marking a student on questions he has already seen.
The size of that reward has been measured. In brain MRI classification, where each subject contributes many slices, splitting by slice inflated accuracy by 30 to 55 percent across four datasets. The authors then did the experiment that settles it. They assigned labels at random and classified again. Split by slice, the random labels scored about 96 percent. Split by subject, the same random labels scored 50 percent8. The structure of the data, with nothing in the labels at all, was worth 46 points of accuracy. Saeb and colleagues had already found that nearly half the clinical machine learning studies they reviewed were splitting record wise, with subject wise splitting the minority practice. Record wise splitting routinely overestimates performance7. Kapoor and Narayanan then went through 17 fields and found leakage of this family in 294 published papers. In one of those fields, once the leakage was repaired, the complex models performed no better than a logistic regression from decades earlier9.
Even with the folds drawn properly, the estimate is wobbling. Varoquaux's experiments put the error bar on a cross validated accuracy at about ten points either way for a hundred samples. The standard deviation across folds, which is what most papers report, badly understates it5. Vabalas and colleagues found the optimism from feature selection inside a plain K fold loop still present at a thousand samples. In a review of one clinical field they found that the smaller the study, the higher the accuracy it reported10. That last finding is the whole post in a sentence. The small studies are finding no extra signal. They are sampling further out on the tail of the null.
3The field knows this and publishes anyway
None of this is obscure. The events per variable problem has a citation from 1996, when Peduzzi and colleagues simulated logistic regressions and showed the coefficients becoming unstable below about ten events per predictor11. Riley's group has since replaced that rule of thumb with explicit criteria: a shrinkage factor of at least 0.9, a small gap between apparent and adjusted R squared, and a precise overall risk. The events per predictor actually required ranged from 4.8 in one worked example to 23 in another12. For external validation of a model predicting an event with a prevalence of 1.8 percent, their calculation asked for 9,835 participants and 177 events to estimate discrimination and calibration precisely13. The fellow has forty one events. His cohort cannot support a precise estimate of its own AUROC. That comes before any question of whether the model is real.
What happens when the field ignores this is on record. A systematic review of 152 studies that developed prediction models with supervised machine learning rated 87 percent of them at high risk of bias. In 56 percent there were too few events per candidate predictor and in 39 percent overfitting was handled improperly15. During the pandemic, 232 models for diagnosing or prognosing COVID were published in a matter of months. Every one of them was rated at high or unclear risk of bias, and only 5 percent were externally validated with a calibration plot16. The tool behind those judgements, PROBAST, asks twenty questions across four domains. Most of the failing answers were in the analysis domain, where the sample size and the validation live17.
And then there is the model everyone cites. The proprietary sepsis model shipped inside the most widely installed electronic record in the United States was validated externally on 38,455 hospitalisations at one academic centre. Its AUROC was 0.63. It alerted on 18 percent of all hospitalisations. It missed 67 percent of the patients who developed sepsis. It identified 7 percent of sepsis patients who had not already been started on antibiotics by the time it fired14. That is what 0.63 looks like at the bedside. It is also, at that sample size, a real number, because at 38,455 hospitalisations the null has collapsed onto 0.5 and 0.63 is clear of it. The fellow's 0.63 and the vendor's 0.63 are two different kinds of number. The only thing separating them is the width of the null.
4Run the null first
The fix is procedural and it belongs before the model, which is exactly why it rarely gets done. Series one of this blog argued that clinical AI is training on aliased snapshots, data sampled too slowly to contain the derivative it is trying to learn. Leaderboards comparing point estimates on such data are comparing artefacts. This post is the statistical half of that argument. Even if the snapshots were adequate, the comparison is being made without a baseline.
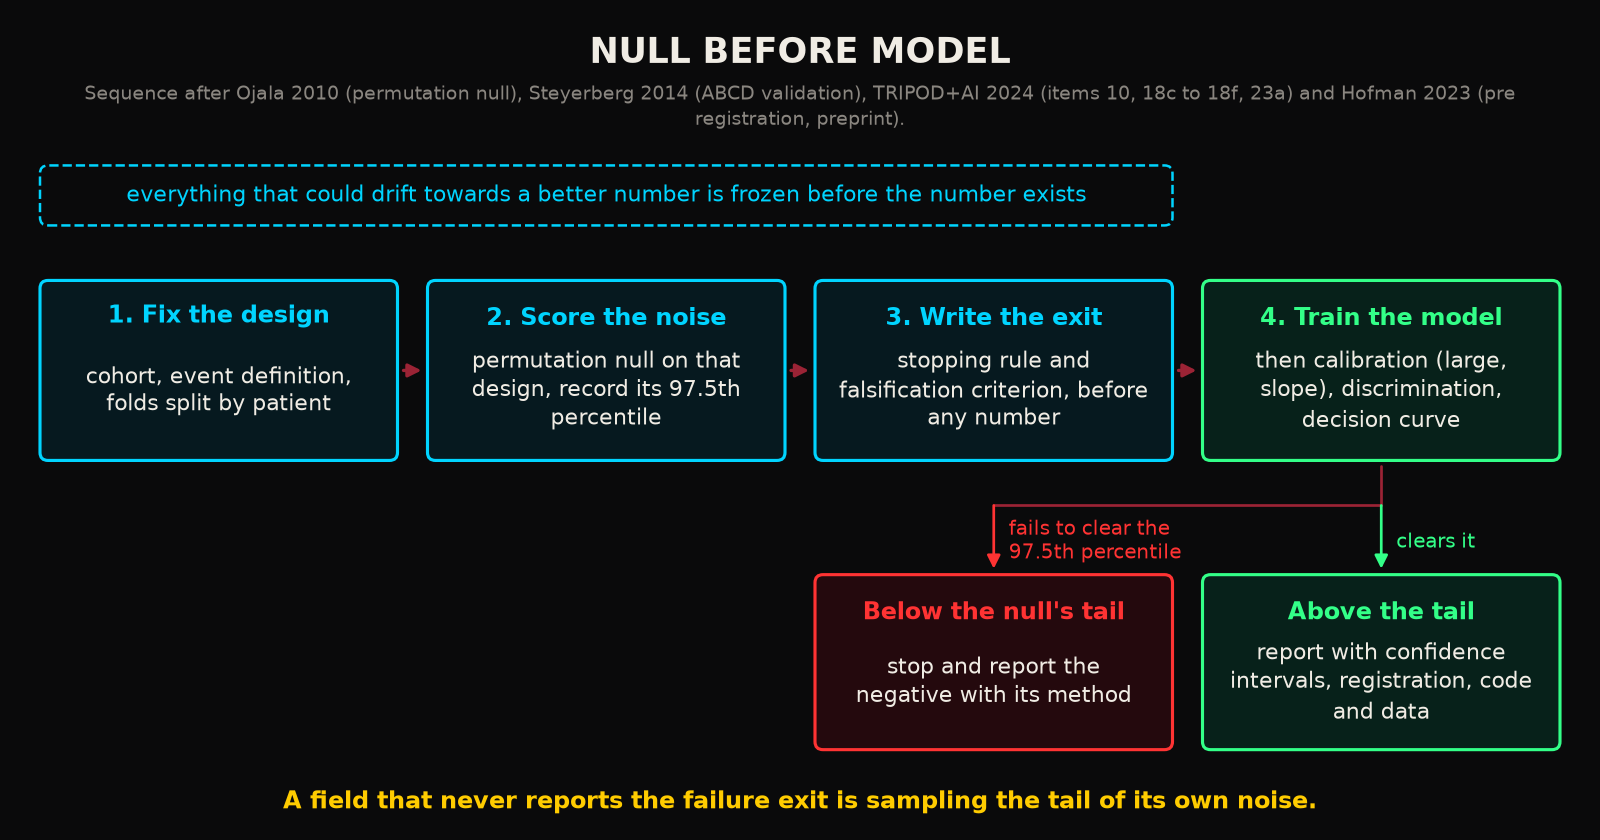
The sequence that physics would recognise, the one clinical machine learning mostly skips, has four steps. First, before any model exists, fix the cohort, fix the folds by patient, and write down the event definition, so that none of these can drift towards a better number later. Second, run the permutation null on that fixed design and record its 97.5th percentile. That percentile is the threshold the model has to clear. It is specific to this cohort and cannot be copied from a textbook. Third, write the stopping rule and the falsification criterion. If the observed AUROC does not clear the null's upper tail, there is no result, and the work stops. If it does, the next test is the one Steyerberg and Vergouwe call the ABCD of validation: calibration in the large, calibration slope, discrimination, and decision curve, in that order18. Fourth, and only then, train the model.
The reporting guidance has caught up with most of this. TRIPOD+AI, published in 2024, asks authors to explain how the study size was arrived at, to say where the protocol can be found, to give the registration number, to report performance with confidence intervals, and to make the data and code available19. Registration is where the field is weakest. Of 928 prediction model studies registered on a public trials registry since 2000, 2.8 percent had a publication two years later and 27 percent after ten20. Pre registration for predictive modelling has been proposed in a form light enough to actually use, by a group whose stated motivation is the unintended reuse of test data. That is a polite name for the fellow re running his folds until the number improved21. It is a preprint and you should read it as one. It is still the right shape.
5The noise has a score
Back to the slide. The fellow's model may be real. On three hundred and twelve admissions with forty one events, split by window, there is no way to tell, and the point estimate on the screen is making a claim it cannot support. The honest version of the slide has two numbers on it: the model's AUROC, and the 97.5th percentile of the null on the same cohort with the same folds. If the first is above the second, the work continues. If it is below, the four months produced a negative result. A negative result is a result. It goes in the manuscript with the method that found it.
Is it harder to do it this way? Only in the sense that it makes the cheap result unavailable. The null costs an afternoon of compute. Fixing the folds by patient costs a line of code. Writing the stopping rule costs a paragraph, written before anyone knows what the number will be, which is the only time it can be written honestly.
The noise has an AUROC too. Until you have measured it, your model is being compared with nothing.
RReferences
- 1.Combrisson E, Jerbi K. Exceeding chance level by chance: the caveat of theoretical chance levels in brain signal classification and statistical assessment of decoding accuracy. J Neurosci Methods. 2015;250:126-136. Author copy.
- 2.Ojala M, Garriga GC. Permutation tests for studying classifier performance. J Mach Learn Res. 2010;11:1833-1863.
- 3.Golland P, Fischl B. Permutation tests for classification: towards statistical significance in image-based studies. Inf Process Med Imaging. 2003;18:330-341. Author reprint.
- 4.Noirhomme Q, Lesenfants D, Gomez F, et al. Biased binomial assessment of cross-validated estimation of classification accuracies illustrated in diagnosis predictions. Neuroimage Clin. 2014;4:687-694.
- 5.Varoquaux G. Cross-validation failure: small sample sizes lead to large error bars. Neuroimage. 2018;180(Pt A):68-77. arXiv preprint.
- 6.Hajian-Tilaki K. Receiver operating characteristic (ROC) curve analysis for medical diagnostic test evaluation. Caspian J Intern Med. 2013;4(2):627-635.
- 7.Saeb S, Lonini L, Jayaraman A, Mohr DC, Kording KP. The need to approximate the use-case in clinical machine learning. Gigascience. 2017;6(5):1-9.
- 8.Yagis E, Atnafu SW, Garcia Seco de Herrera A, et al. Effect of data leakage in brain MRI classification using 2D convolutional neural networks. Sci Rep. 2021;11:22544.
- 9.Kapoor S, Narayanan A. Leakage and the reproducibility crisis in machine-learning-based science. Patterns. 2023;4(9):100804.
- 10.Vabalas A, Gowen E, Poliakoff E, Casson AJ. Machine learning algorithm validation with a limited sample size. PLoS One. 2019;14(11):e0224365.
- 11.Peduzzi P, Concato J, Kemper E, Holford TR, Feinstein AR. A simulation study of the number of events per variable in logistic regression analysis. J Clin Epidemiol. 1996;49(12):1373-1379. Open archive.
- 12.Riley RD, Snell KI, Ensor J, et al. Minimum sample size for developing a multivariable prediction model: part II, binary and time-to-event outcomes. Stat Med. 2019;38(7):1276-1296.
- 13.Riley RD, Debray TPA, Collins GS, et al. Minimum sample size for external validation of a clinical prediction model with a binary outcome. Stat Med. 2021;40(19):4230-4251.
- 14.Wong A, Otles E, Donnelly JP, et al. External validation of a widely implemented proprietary sepsis prediction model in hospitalized patients. JAMA Intern Med. 2021;181(8):1065-1070.
- 15.Andaur Navarro CL, Damen JAA, Takada T, et al. Risk of bias in studies on prediction models developed using supervised machine learning techniques: systematic review. BMJ. 2021;375:n2281.
- 16.Wynants L, Van Calster B, Collins GS, et al. Prediction models for diagnosis and prognosis of covid-19: systematic review and critical appraisal. BMJ. 2020;369:m1328.
- 17.Wolff RF, Moons KGM, Riley RD, et al. PROBAST: a tool to assess the risk of bias and applicability of prediction model studies. Ann Intern Med. 2019;170(1):51-58.
- 18.Steyerberg EW, Vergouwe Y. Towards better clinical prediction models: seven steps for development and an ABCD for validation. Eur Heart J. 2014;35(29):1925-1931.
- 19.Collins GS, Moons KGM, Dhiman P, et al. TRIPOD+AI statement: updated guidance for reporting clinical prediction models that use regression or machine learning methods. BMJ. 2024;385:e078378.
- 20.White N, Parsons R, Borg D, Collins G, Barnett A. Planned but ever published? A retrospective analysis of clinical prediction model studies registered on clinicaltrials.gov since 2000. J Clin Epidemiol. 2024;173:111433.
- 21.Hofman JM, Chatzimparmpas A, Sharma A, Watts DJ, Hullman J. Pre-registration for predictive modeling. arXiv:2311.18807. 2023. Preprint, not peer reviewed.
Declarations
Competing interests. The author is the founder of Aethryva Deeptech, which develops the tachyDx platform and the MOISSCode language. Where an article in this series mentions either, it says so in the text and the mention follows the argument.
Sources and figures. Every reference in this article is an open access source that any reader can open without payment. The figures were drawn by the author from the values printed in those sources, or are labelled as schematic where no published value exists. No patient data were used.
Cite this article
Kunche N. Noise in ICU data is enough to produce a respectable AUROC. The Intervention. 20 August 2026. https://nikhilkunche.com/blog/noise-in-icu-data-is-enough-to-produce-a-respectable-auroc
Comments