
It is 3 AM in a medical ICU. You are holding two printouts that disagree. The blood gas analyser at the end of the bay has just reported a bicarbonate of 24 on a ventilated patient. The chemistry panel, drawn an hour earlier and run on a different machine two floors down, reported a total CO2 of 19. Five millimoles is the difference between a patient who is fine and a patient who is quietly acidotic. There is no third machine to ask. You do what registrars do, which is send another gas. The second gas agrees with the first. That proves only that the analyser agrees with itself.
There is no reference sample on the unit. What you have, without knowing it, is something better. The analyser never measured the bicarbonate at all. It measured a pH and a pCO2 with two electrodes and calculated the bicarbonate from them (the printout does not say so). The three quantities are bound by one equation, and any two of them fix the third. The chemistry laboratory measured the total CO2 directly, by a different chemistry, on a different day of its calibration cycle. Two routes arrived at the same quantity. It is two clocks set by different radio signals. They are supposed to land within a couple of millimoles of each other. When they land five apart, the gap is the diagnosis. The only question left is which channel it is pointing at.
1The equation does the audit
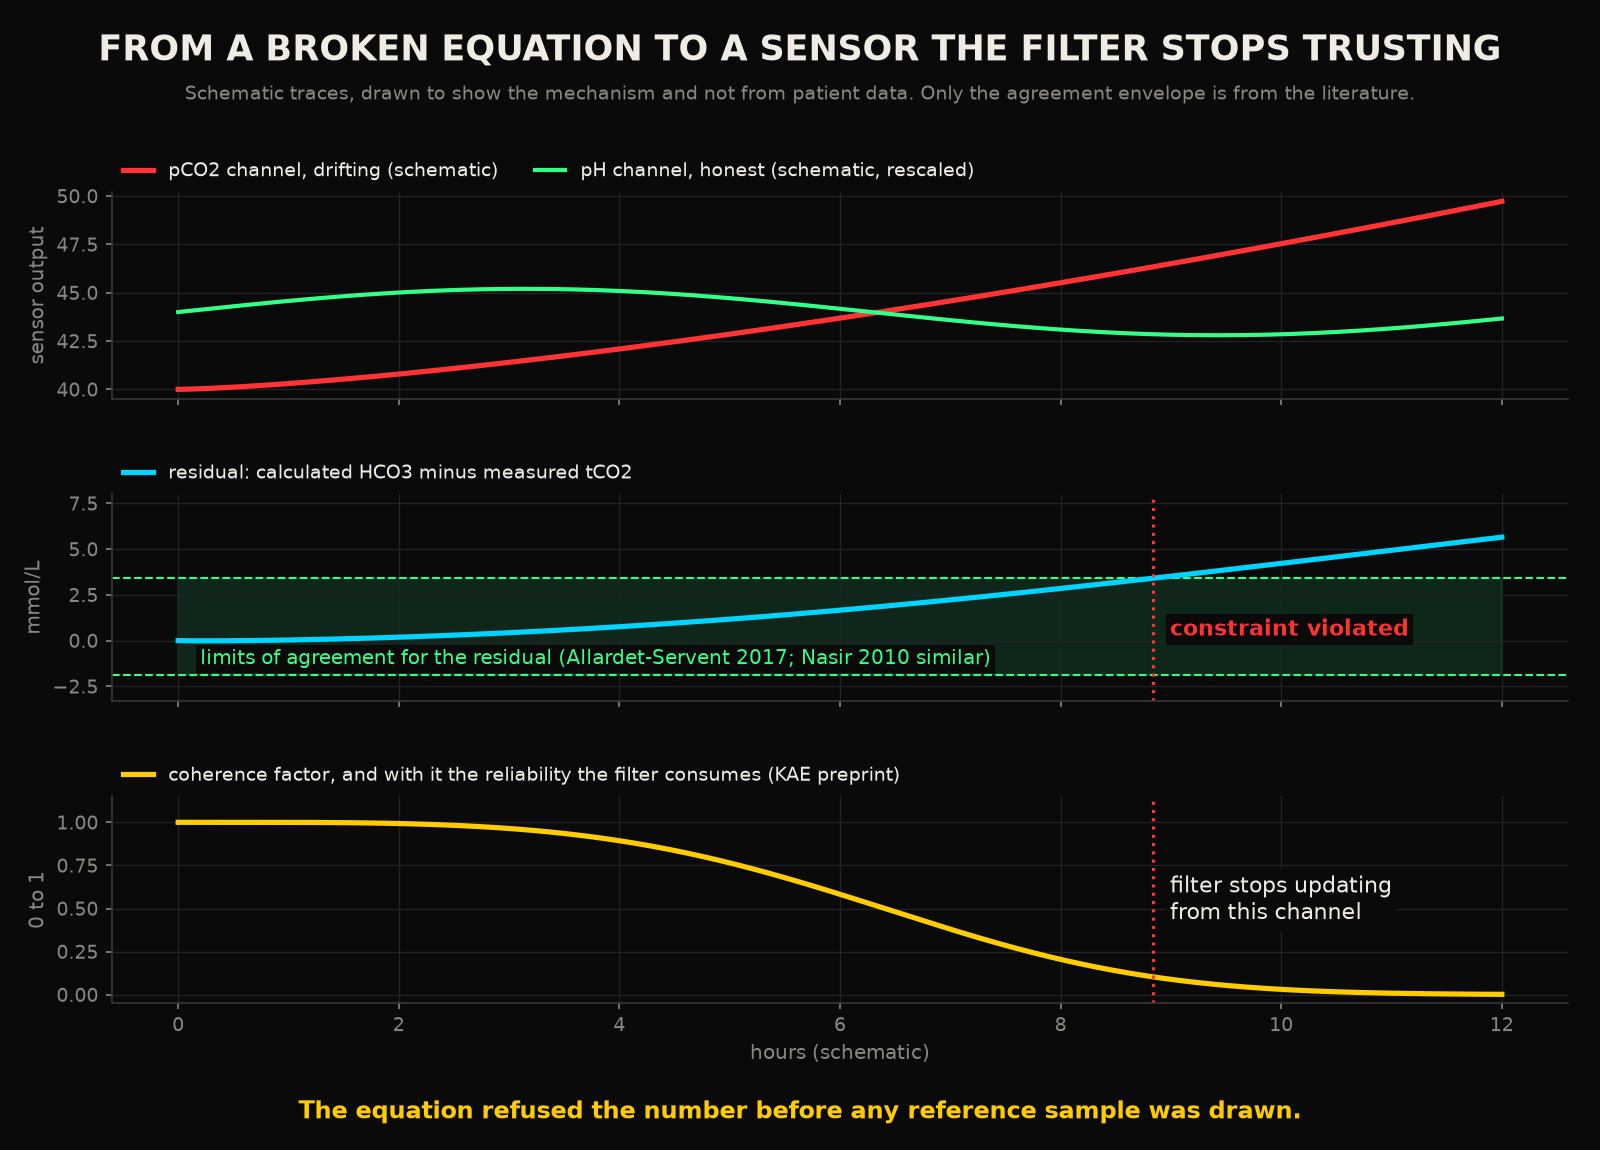
How tightly the two routes are supposed to agree is a measured thing. When a Malaysian laboratory compared calculated bicarbonate against measured total CO2 on paired samples, the mean difference was 0.87 mmol/L, with limits of agreement from minus 1.92 to 3.671. In a French ICU the comparison was between the bedside blood gas analyser and the central laboratory on 314 critically ill patients. The bias for bicarbonate was 0.8 mmol/L, with limits of agreement from minus 1.9 to 3.42. Two populations, two decades, two instrument pairs, one envelope. The routes agree to within about one millimole on average and three millimoles at the edges. A gap of five sits outside that envelope in both studies. It is a fault signal before you have looked at the patient.
The envelope has a baseline that depends on which machines are talking. A 2026 study that ran the comparison across instrument pairs found the largest bias, 2.63 mmol/L, between a Radiometer blood gas analyser and an Abbott chemistry platform3. A laboratory that wants to use the disagreement as a check has to learn its own pair first (yours included). That is an argument for doing the check systematically. A one off comparison on a night shift has no way of knowing whether a two millimole gap is drift or house style.
What makes the check powerful is what it does when it fires. In a case series from New Mexico, measured total CO2 and calculated bicarbonate disagreed on a set of patients. The investigation traced every discrepancy to the same place: the bicarbonate had been calculated wrongly4. The constraint confined the fault to the channels inside the relation. Once two of the three were trusted, the third was named. That is the whole post in one sentence. Notice that it needed no reference sample, no second instrument and no phone call to the laboratory. The equation did the audit.
2The panel is full of these
Acid base is the cleanest example because the equation is written on the printout. It is far from the only relation the panel has to satisfy. A haemoglobin and a haematocrit describe the same red cells from two directions. Bench haematologists have checked one against the other for generations with a rule so old that it goes uncited: three times the haemoglobin should be close to the haematocrit. The rule only holds when the cells are normal in size and colour5. On a blood gas analyser the two are physically different measurements, the haemoglobin by spectrophotometry and the haematocrit by conductivity. When a Zurich ICU compared the conductivity haematocrit against the haematology analyser, the bias was 1.39 percent with a two standard deviation band of 3.12 percent. That was enough for 22.7 percent of transfusion decisions to go differently depending on which number the clinician read6. Read as a nuisance, that is a disagreement between two instruments. Read as a constraint, it is a second equation the panel has to satisfy. A drifting conductivity cell will fail it while the optical channel is still telling the truth.
Then there is electroneutrality. The sodium, potassium, chloride and bicarbonate on a panel are charges. Charges have to balance, which is why the anion gap exists as a bedside habit. A gap that jumps with no lactate, no ketones and no toxin in the history is read by every resident as a laboratory problem first and a patient problem second. You have done this yourself. That instinct is a constraint check performed in the head, on one panel, once a day.
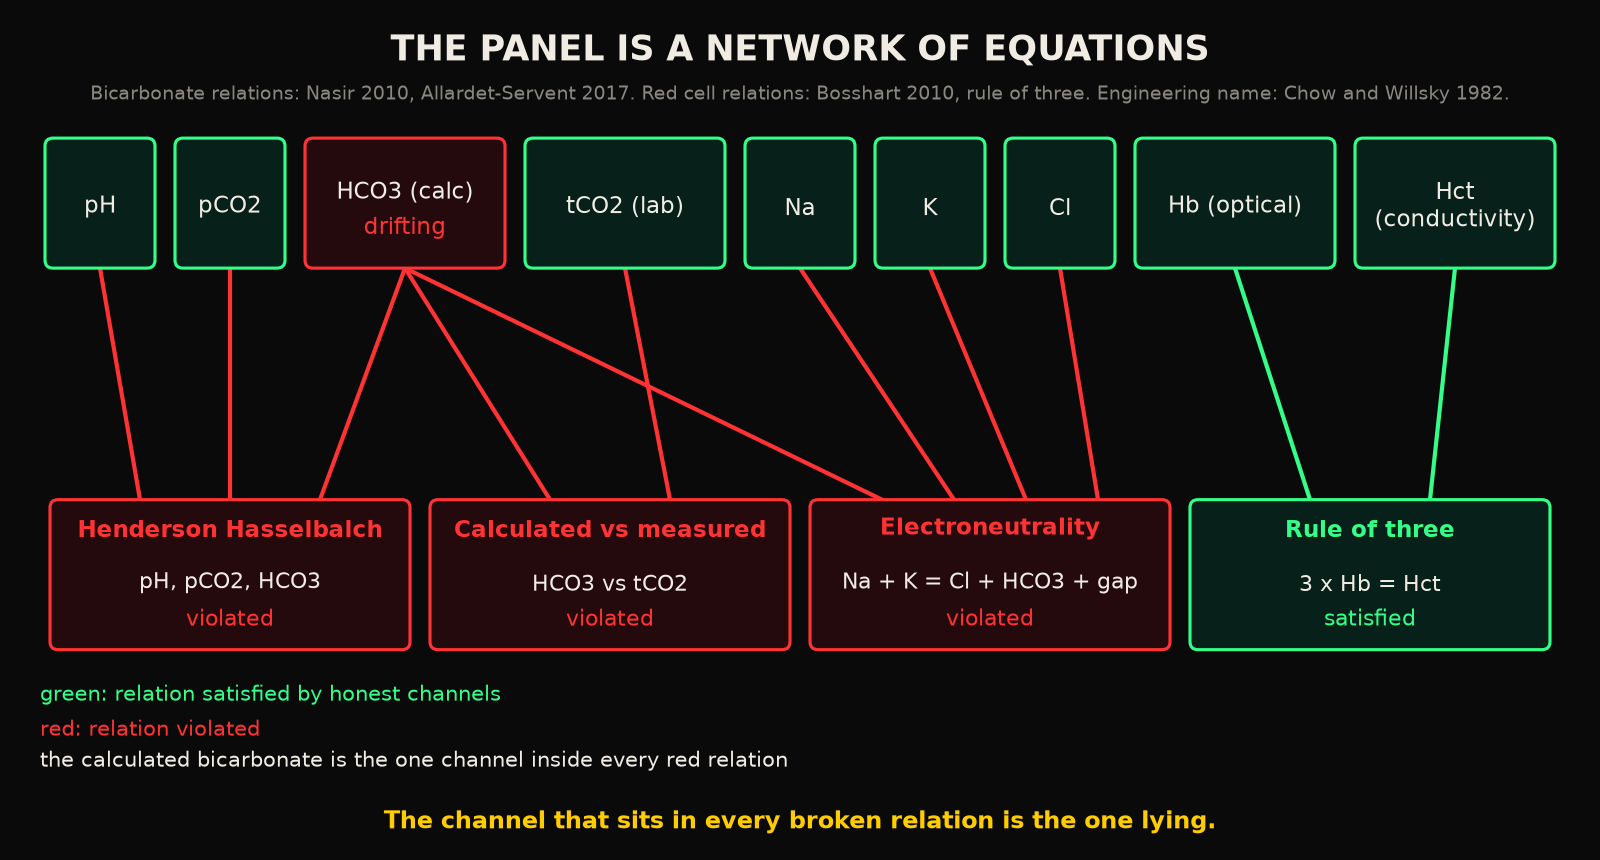
Line those relations up and the panel stops looking like a list of independent numbers. It becomes a small network. Each sensor sits inside one or more equations. A violated equation does not say which of its members is lying. It does narrow the suspects to its members. Where a sensor sits in two equations and both are violated, the overlap names it. This is how a fault gets localised without an external reference. The workflow that runs the chemistry panel in the basement and the gas at the bedside, hours apart, is the only reason the network is never evaluated as a network.
3How much drift is worth catching
The drifts that matter are small. That is the reason they survive. Laboratory medicine states what an analyser is allowed to get wrong as a desirable imprecision, derived from how much the analyte varies inside a healthy person. The numbers are humbling. For sodium the desirable imprecision is 0.3 percent and the desirable total error is 0.73 percent, because sodium barely moves within a person7. A drift of one millimole on a sodium of 140 is 0.7 percent. That is already at the limit of what the whole measurement is allowed to be wrong by. On a trend chart a one millimole drift is invisible. Potassium is allowed 2.3 percent, glucose 2.8, haemoglobin 1.43, haematocrit 1.35, total CO2 2.0, and pH a coefficient of variation of 0.1 pH units7. Those specifications date from the 2014 update. The field has since moved its source of record to the European database, which covers fewer analytes with better evidence8. The order of magnitude is the point here and it has not changed.
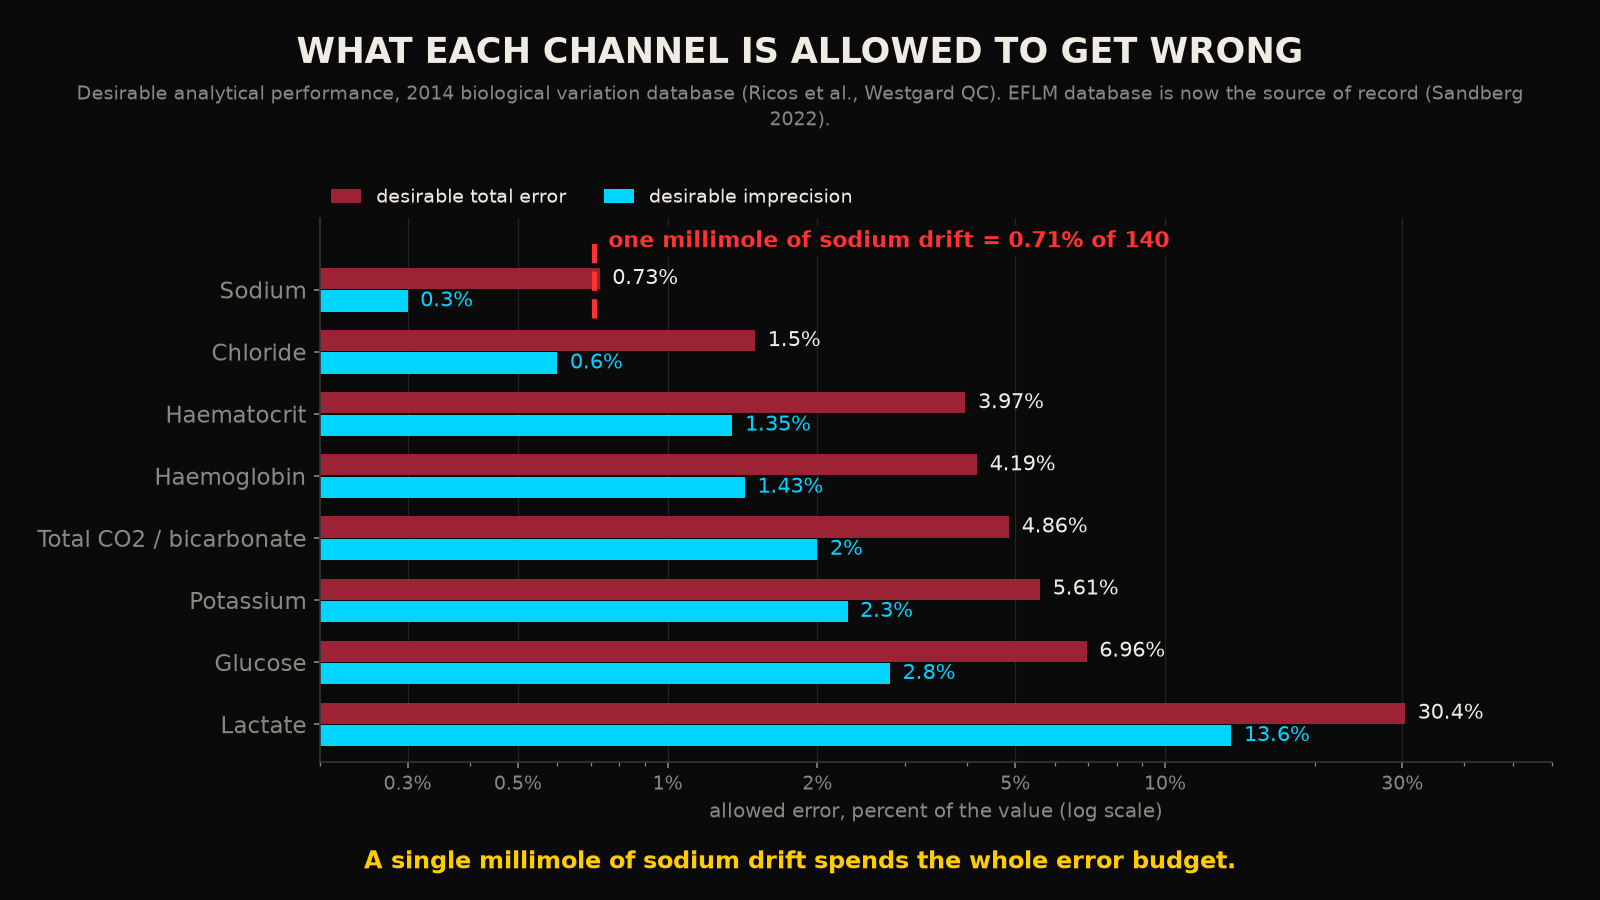
Against budgets that tight, a reference sample once a day is a coarse instrument. The relations in the network are evaluated on every measurement. They do not care whether the drift is one millimole or ten. They care whether the channels still add up.
4What the laboratory already does by hand
Laboratories have known for decades that a number can be wrong without being out of range. The standard defence is the delta check: compare today's result with the same patient's last one and flag a change that is implausibly large. It is universal practice. When the College of American Pathologists surveyed 49 facilities, they logged 6,541 delta check alerts across 4,505 testing episodes. The commonest outcome of an alert was a clinical review, in a median of 38 percent of episodes9. In 55.8 percent of episodes the flagged result went out unmodified9. That is a lot of phone calls for a check that mostly confirms what it questioned.
The deeper problem is what a delta check compares. It compares a patient to their own past, and a sick patient has every right to change. A simulation on the records of roughly 8,000 inpatients in Calgary found that conventional delta check rules, across six combinations of equation and cut off, ran at specificities between 50 and 99 percent while their sensitivities were generally below 20 percent10. The check cannot tell a specimen error from a patient whose potassium genuinely moved, because both look like a jump against yesterday. A physical constraint compares channels to each other at the same instant, in the same tube. A patient cannot violate the Henderson Hasselbalch equation by getting sicker. Only a sensor can.
The instrument makers have understood part of this. Modern blood gas analysers run internal quality management continuously between scheduled calibrations. An evaluation of one such system found it flagging errors in about 1.46 percent of samples and detecting them faster than the traditional scheduled checks did11. Vendors describe routine calibrations that correct slope and offset drift and a full recalibration triggered when excessive drift is detected in a sensor12. All of that happens inside the analyser's own box, against the analyser's own reagents. The chemistry panel that would have caught the five millimole gap at 3 AM lives in a different box. Basically, the two boxes have never been asked to agree.
5Engineering has a name for this
Control engineers worked this out for aircraft and reactors, where a duplicate sensor costs weight and money. Analytical redundancy, as defined in a 1982 MIT report that opened the field, means using the known functional relations among the measurements you already have, in place of duplicate hardware, to detect and isolate a failed sensor13. The residual of a relation that should hold, evaluated on live measurements, is the fault signal. A set of overlapping relations gives a set of residuals. The pattern of which ones have moved points at the sensor. Four decades on, the synthesis of filters that generate those residuals, and the conditions under which a fault can be detected and isolated at all, are a settled computational discipline with its own software14.
Nothing in that literature is about blood. None of it needs to be. The blood panel is a plant with a known set of algebraic relations. Those relations are among the oldest equations in physiology. What the field is missing is only the decision to evaluate them continuously, on one instrument, at the moment of measurement. That is the one arrangement the hospital workflow makes impossible.
6What a continuous instrument could do with it
Under intermittent sampling, the constraint check is a daily sanity exercise, performed across machines, hours apart, with a baseline that has never been characterised. Under continuous measurement it becomes something else: a live estimate of how far each channel can be trusted, updated with every reading. An earlier post in this series described a filter that stops trusting a sensor when the sensor stops deserving it15. In that published formulation, the reliability of a measurement is a product of four factors. One of them is coherence, a score of how far the reading sits from what the other channels predict for it. A reading that breaks the relations it belongs to drives that factor towards zero. The product collapses with it, and the filter leans on its model until the channel starts adding up again. The equation on the printout, in other words, is already the input the estimator consumes. It has just never been fed continuously.
Two honest limits belong here. The first is that a constraint localises and does not diagnose. The rule of three breaks on abnormal cells as readily as on a bad sensor, and the check only knows that the relation has failed. So the instrument has to carry the physiological exceptions as known cases. The second is that every relation has an instrument dependent baseline, the 2.63 millimoles of one pairing against the 0.8 of another. That baseline has to be learned per channel before a residual means anything. Neither limit is a reason to keep throwing the relations away.
Physiology is full of conservation laws: charge balances, mass balances, carbon dioxide dissolving at a fixed ratio and binding at a fixed constant. Each of those laws is a free calibration standard, supplied by the patient, on every sample. The current workflow discards every one of them by measuring the members of each relation on different machines at different times. Does anyone believe that the 3 AM registrar, with two printouts and no reference, is the right place for that audit to happen for the first time?
The chemistry has to add up, and the drifting sensor is the one number in the panel that will not.
RReferences
- 1.Nasir NM, Sthaneshwar P, Yunus PJ, Yap SF. Comparing measured total carbon dioxide and calculated bicarbonate. Malays J Pathol. 2010;32(1):21-26.
- 2.Allardet-Servent J, Lebsir M, Dubroca C, et al. Point-of-care versus central laboratory measurements of hemoglobin, hematocrit, glucose, bicarbonate and electrolytes: a prospective observational study in critically ill patients. PLoS One. 2017;12(1):e0169593.
- 3.Tang NY, Gherasim C, Schroeder L, Liao HC, Sun Q. Assessment of instrument-specific variation between measured and calculated bicarbonate. J Appl Lab Med. 2026;11(3):483-492.
- 4.Kim Y, Massie L, Murata GH, Tzamaloukas AH. Discrepancy between measured serum total carbon dioxide content and bicarbonate concentration calculated from arterial blood gases. Cureus. 2015;7(12):e398.
- 5.Sysmex America. Hematology white paper: the influence of RBC counting technology on MCHC results. Manufacturer document, accessed 2026.
- 6.Bosshart M, Stover JF, Stocker R, et al. Two different hematocrit detection methods: different methods, different results? BMC Res Notes. 2010;3:65.
- 7.Ricos C, Alvarez V, Cava F, et al. Desirable biological variation database specifications, 2014 update. Hosted by Westgard QC.
- 8.Sandberg S, Carobene A, Aarsand AK. Biological variation: eight years after the 1st Strategic Conference of EFLM. Clin Chem Lab Med. 2022;60(4):465-468.
- 9.Schifman RB, Talbert M, Souers RJ. Delta check practices and outcomes: a Q-Probes study involving 49 health care facilities and 6541 delta check alerts. Arch Pathol Lab Med. 2017;141(6):813-823.
- 10.Ovens K, Naugler C. How useful are delta checks in the 21st century? A stochastic-dynamic model of specimen mix-up and detection. J Pathol Inform. 2012;3:5.
- 11.Tang H, Xiao Y, Luo H, et al. Analytical performance evaluation of intelligent quality management of blood gas analyzer. Pract Lab Med. 2025;45:e00480.
- 12.Siemens Healthineers. Integri-sense technology, RAPIDPoint 500e. Manufacturer page, accessed 2026.
- 13.Chow EY, Willsky AS. Analytic redundancy and the design of robust failure detection systems. MIT Laboratory for Information and Decision Systems, report LIDS-P-1253; 1982.
- 14.Varga A. Fault detection and diagnosis: computational issues and tools. arXiv:1902.11186; 2019, revised 2022.
- 15.Kunche N. The Kunche Adaptive Estimator: reliability weighted state estimation for intermittent clinical measurements. Authorea preprint; 2025.
Declarations
Competing interests. The author is the founder of Aethryva Deeptech, which develops the tachyDx platform and the MOISSCode language. Where an article in this series mentions either, it says so in the text and the mention follows the argument.
Sources and figures. Every reference in this article is an open access source that any reader can open without payment. The figures were drawn by the author from the values printed in those sources, or are labelled as schematic where no published value exists. No patient data were used.
Cite this article
Kunche N. The Henderson-Hasselbalch equation checks a blood gas analyser against itself. The Intervention. 10 September 2026. https://nikhilkunche.com/blog/the-henderson-hasselbalch-equation-checks-a-blood-gas-analyser-against-itself
Comments