
It is 9 AM on the round and the registrar is presenting bed 4. Day three of a methicillin resistant staphylococcal bacteraemia, on vancomycin, creatinine 1.6 this morning against 1.1 on admission. The pharmacist has already done the arithmetic. Estimated clearance is down, the interval is stretched from twelve hourly to twenty four, and the next level is due before the fourth dose. Everyone nods, because everything about this is correct (I would have nodded too). The creatinine was drawn at 5 AM with the morning panel. The result came back at 8. The nomogram was applied properly and the dose has been reduced.
Now read the urine output chart as a curve. It was 60 mL an hour at midnight, 35 at 3 AM, and 15 for the last two hours. The kidney that cleared the dose given at 10 PM is a different organ from the kidney that will be asked to clear the dose given at 10 AM. The creatinine on the whiteboard belongs to neither of them. It belongs to a kidney somewhere between the two, averaged over the hours it took the molecule to accumulate.
The first post of this blog argued that a lab value is a photograph of yesterday's patient. Here that photograph costs the most. The drug is in the body now. The kidney that has to remove it is being described by a number from last night.
1The number arrives late twice
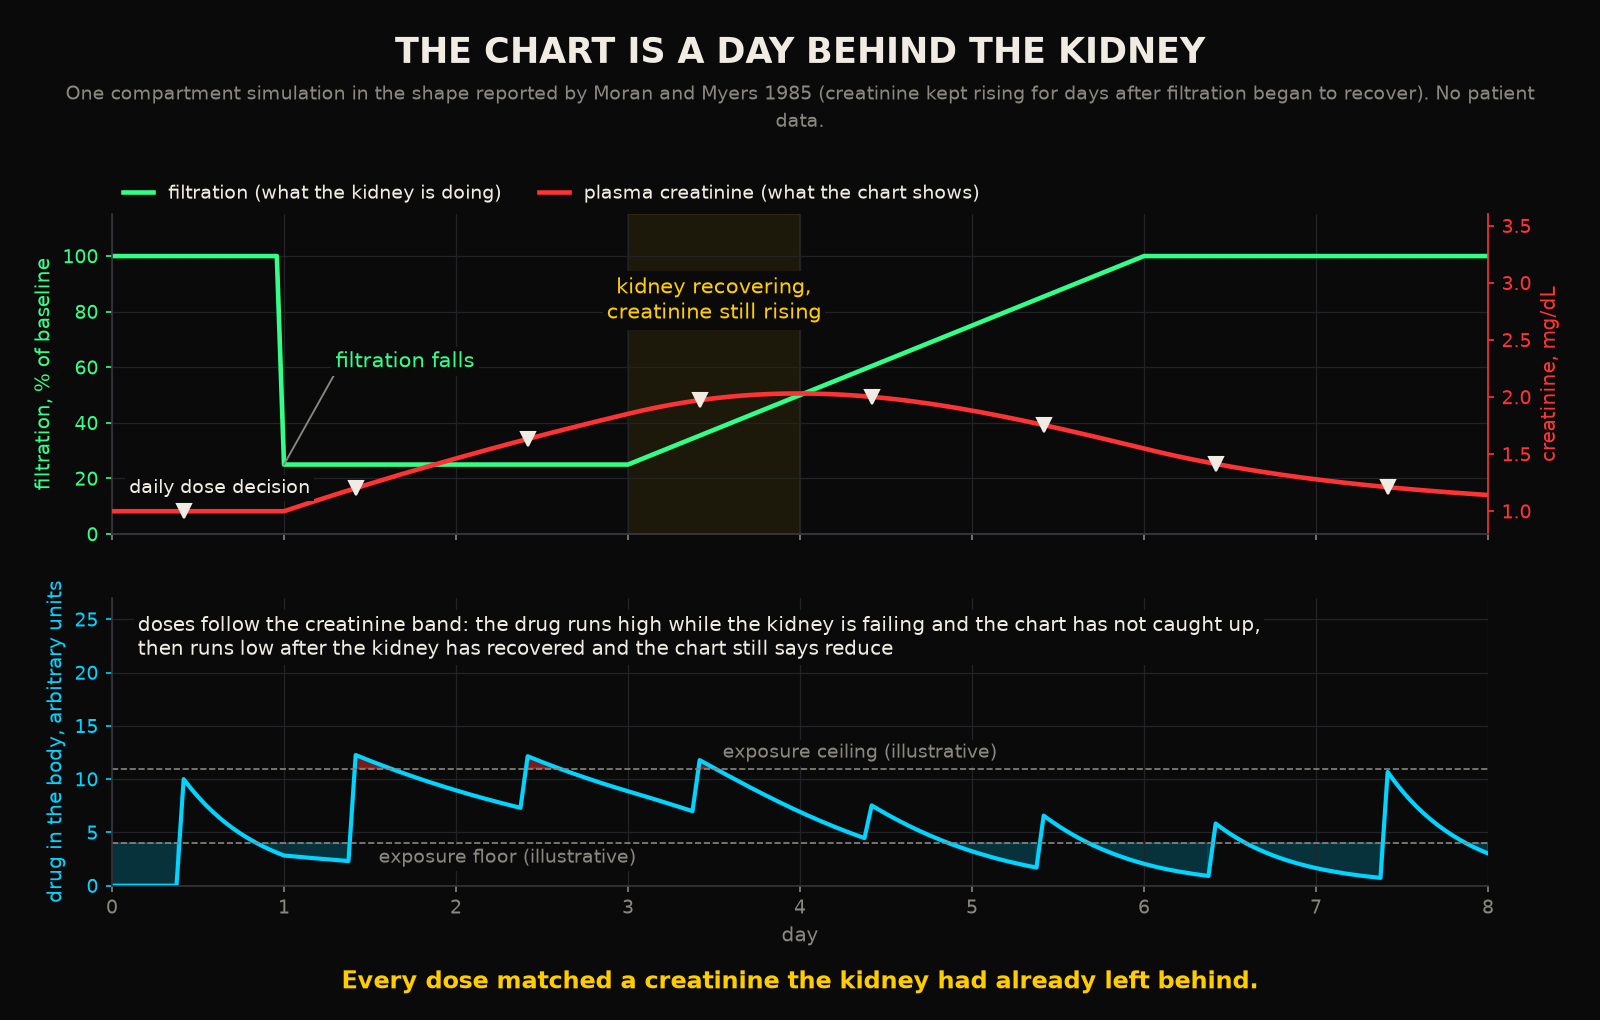
Creatinine is a lagging indicator by its chemistry. Muscle makes it at a roughly constant rate. The kidney filters it out. Its concentration therefore reflects the balance of production and clearance integrated over time. When clearance falls, the concentration takes days to climb to its new level. Moran and Myers modelled this in patients with acute renal failure and showed the uncomfortable half of the picture. After an abrupt fall in glomerular filtration rate, the measured creatinine continued to increase for several days
even after filtration had already begun to recover1. In their words, changes in measured plasma creatinine levels alone failed to identify these patterns
1. So a rising creatinine can be sitting on top of a recovering kidney. A creatinine that has only just started to rise can be sitting on top of a kidney that failed last night.
Then the laboratory adds its own delay. In a Queensland hospital that sent its vancomycin assays off site, the level reached the prescriber a median 11.1 hours after the blood was drawn. At two hospitals with an on site assay it was 1.7 hours2. The authors linked several incidents during the off site period to the wait. When the assay was brought in house the median fell to 1.3 hours2. So the dose on the round is being adjusted to a creatinine that is physiologically a day or more behind the kidney. The level that is meant to catch the error can be half a day behind the blood.
2The nomogram assumes a patient who is standing still
Every renal dosing table in the hospital descends from the same kind of experiment. Matzke and colleagues gave a single dose of vancomycin to 56 patients across the range of renal function. They measured each patient's creatinine clearance once and fitted one line through the result: vancomycin clearance equal to 3.66 plus 0.689 times creatinine clearance, with a correlation of 0.88. In their words, this relationship was utilized to develop a nomogram for initial and maintenance dosing
3. It is good science. It is also, by construction, a description of patients whose renal function held still long enough to be measured once. The half lives it reports, from nine hours in the best group to 147 hours in the worst, are the half lives of a kidney at steady state.
The equations that estimate clearance from creatinine carry the same assumption, and the people who use them in intensive care know it. Kwong and colleagues state plainly that creatinine clearance and the CKD-EPI estimate are not valid when serum creatinine is not in steady state
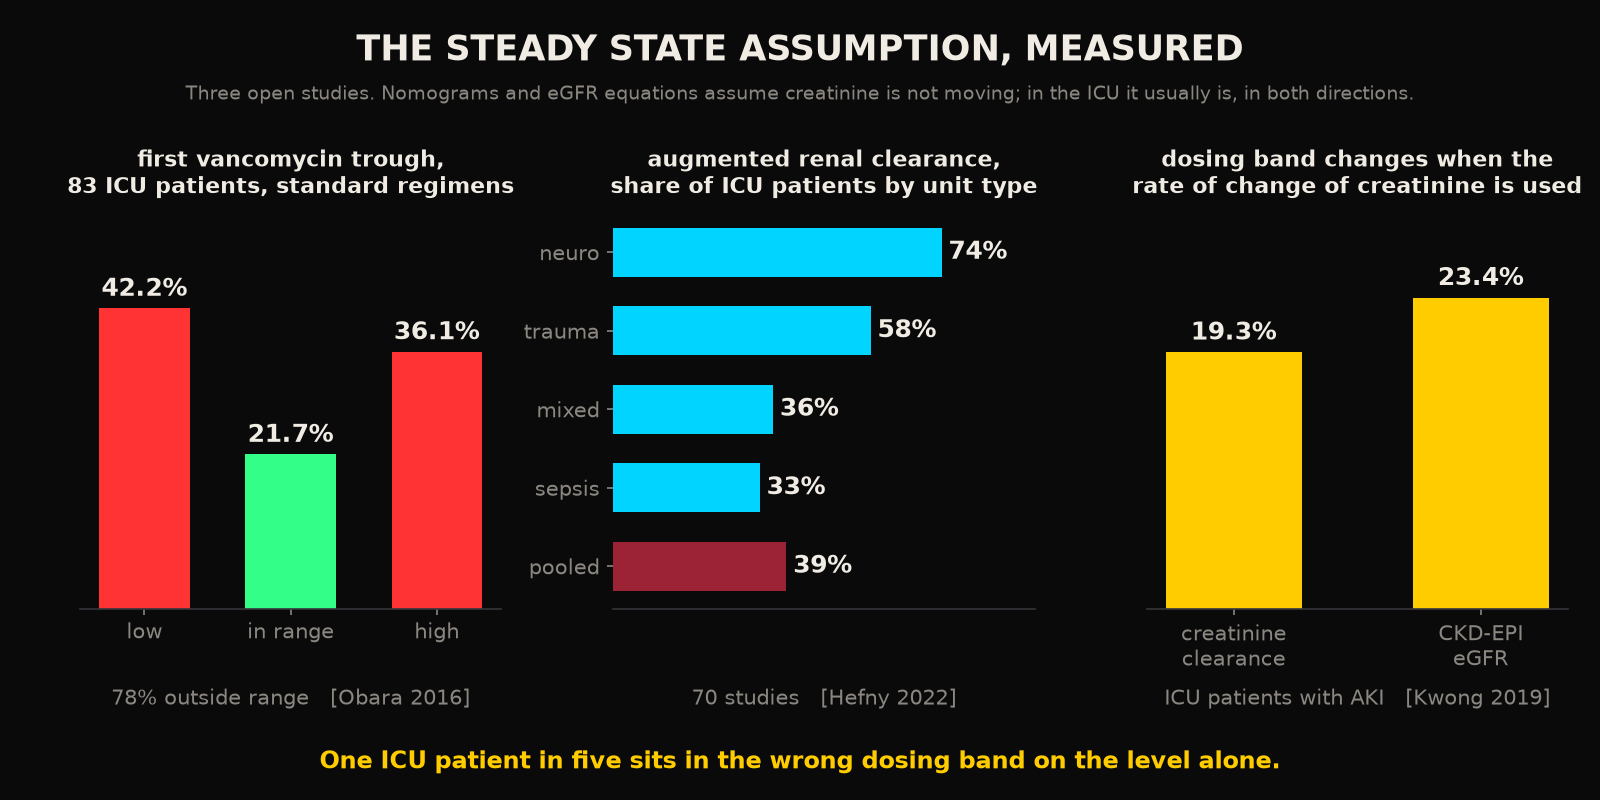
4. They then applied a kinetic estimate, one that uses the rate of change of creatinine, to ICU patients with acute kidney injury. The renal dosing category changed in 19.3 percent of patients by one equation and 23.4 percent by the other4. Read that as a measurement of how often the level and the velocity disagree. For roughly one patient in five on your unit, the dose written from the number on the whiteboard belongs in a different band from the dose written from the direction the number is going.
The consequence shows up at the first trough. In 83 ICU patients given the regimens in ordinary use, the initial trough was low in 42.2 percent, adequate in 21.7 percent and high in 36.1 percent5. The patients with acute kidney injury had significantly higher levels than the rest. Four in five were outside the range on the first measurement. The ones with the moving kidney were wrong in the dangerous direction.
3The same mistake in the other direction
If creatinine lag only ever caused accumulation, the fix would be a cautious prescriber. It causes the opposite error just as often. A large fraction of ICU patients clear drugs faster than normal, and their creatinine says nothing about it. A meta analysis of seventy studies put the pooled prevalence of augmented renal clearance at 39 percent of ICU patients, 74 percent in neurological ICUs and 58 percent in trauma units6. Younger age, male sex and trauma were the predictors. One Argentine unit excluded anyone with a creatinine above 1.3 mg/dL, so that every patient looked normal on paper. Even so, 28 percent of 363 patients had augmented clearance7. Among those who received vancomycin, the ones with augmented clearance had lower concentrations despite higher doses7.
So the lag runs both ways. In the septic patient whose kidney is failing, the creatinine understates the loss and the drug accumulates. In the young trauma patient whose kidney is hyperfiltering, the creatinine looks ordinary and the drug never reaches the infection. The error is the same in both. The number on the chart is being read as a property of the patient, when it is a property of the patient averaged over the past day or two.
4What the guideline asks for, and what the ward cannot give it
The 2020 consensus guideline from the American pharmacy and infectious disease societies has already given up on the trough. It recommends a daily area under the curve between 400 and 600 mg·h/L. It states that trough-only monitoring, with a target of 15 to 20 mg/L, is no longer recommended
, prefers Bayesian software to estimate the exposure, and asks for frequent or daily monitoring in patients with unstable (ie, deteriorating or significantly improving) renal function
8. The executive summary is blunter about why: trough targeting is associated with more nephrotoxicity9. Basically the guideline is asking for a continuous quantity, the exposure, in patients whose clearance is explicitly acknowledged to be moving.
The software can only do that with the patient's own levels. Three commonly used Bayesian programs were tested against 284 concentrations from 139 ICU patients. The a priori prediction, made from population parameters before any measured level was entered, carried a relative error of 45 to 69 percent and in one model a bias of 27 percent. The error fell to 28 to 38 percent once the patient's levels were fed back10. The model is doing what a model can do with a population prior and a creatinine. What it lacks is the patient's trajectory. The ward measures the trajectory once a day.
There is an older signal pointing the same way. Across fourteen studies and 1,640 patients, intermittent dosing reached the target concentration less often than continuous infusion, with a relative risk of 0.72. It was also more nephrotoxic, with a relative risk of 1.7011. A continuous infusion tracks the patient continuously. A twelve hourly bolus makes a discrete bet on a clearance that may have changed before the next bet is placed.
None of this is confined to vancomycin. None of it is new. A Boston hospital built dose and frequency guidance for renally cleared drugs into its order entry system and ran it against 97,151 orders in 7,490 patients with renal insufficiency. The proportion of prescriptions appropriate by dose rose from 54 to 67 percent and by frequency from 35 to 59 percent12. That was the result with decision support. Without it, nearly half the doses and two thirds of the frequencies were wrong. Twenty years later, a meta analysis of 1,918 African inpatients with renal impairment found that 39.3 percent of the drugs needing adjustment were still being adjusted inappropriately13. And when someone who checks the kinetics again is put into the loop, it works. Across 63 studies, pharmacist led monitoring of vancomycin raised target attainment with a relative risk of 1.60, cut acute kidney injury with a relative risk of 0.67 and was associated with a halving of 30 day mortality14. The common thread in the interventions that helped is that each one made a person look at the direction of the kidney more often.
5The dose is a function of a velocity
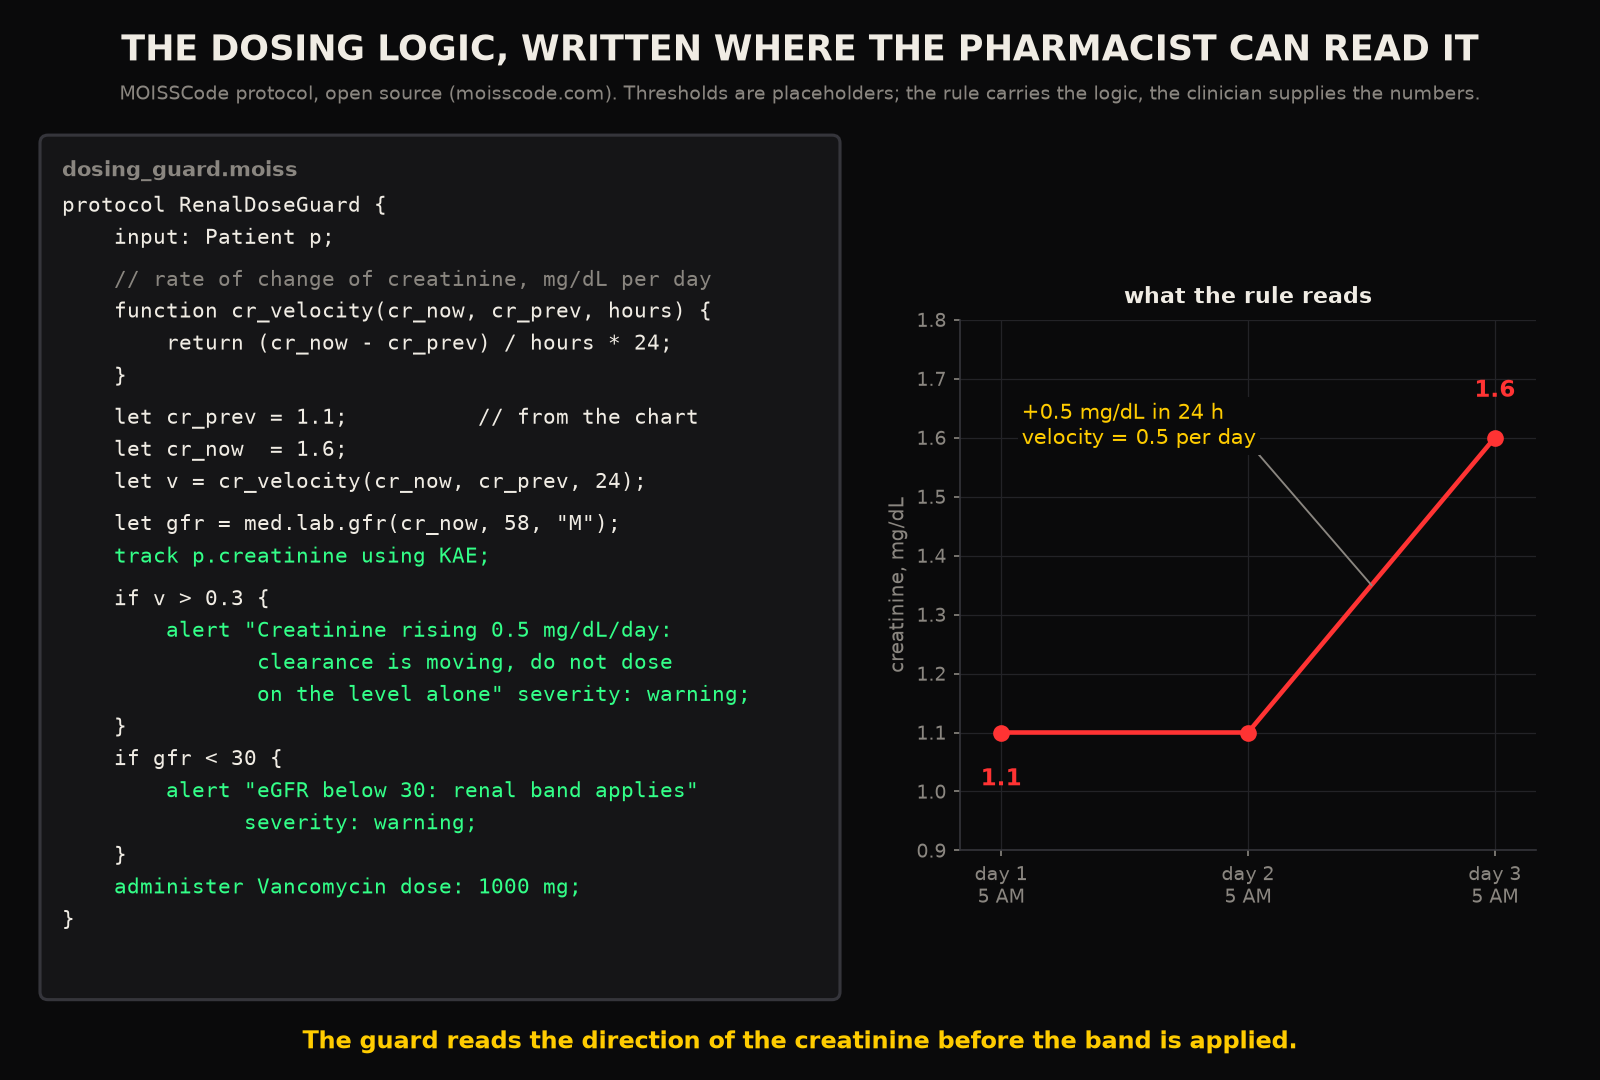
Strip away the pharmacokinetics and the problem is one sentence long. The right dose of a renally cleared drug depends on the clearance at the time the drug is in the body, clearance is changing, and the chart shows a level that trails the clearance by a day. Two creatinines twenty four hours apart give a slope. A slope averaged over a day hides the turn that happened at 3 AM (the turn you saw in the urine output and could not put into the nomogram). The information the prescriber needs is the velocity of renal function. What I mean by that is the direction and speed of the creatinine, not its level. The gap is that no screen in the hospital displays that velocity. Is it reasonable to expect a pharmacist on a thirty bed round to reconstruct it in her head for every renally cleared drug on every patient?
This is what two of the tools built at Aethryva are for, and neither of them is a dosing calculator. In tachyDx Teams the creatinine trend sits in front of the prescriber with the drug administration record on the same clock, so the slope and the doses it should govern are one chart. An intensivist has been running it on her own phone since July. MOISSCode, the open source clinical language, lets a clinician write the dosing rule as a short protocol in the vocabulary of the ward, with the renal function call and the rate of change as inputs and an alert as the output. The rule is readable by the pharmacist who has to check it, which is what makes it arguable. Neither tool tells anyone the dose, and none of it is a validated dosing recommendation. Its job is to make the moving number visible and the logic auditable.
6The patient had already moved
Back at bed 4, the dose has been halved against a creatinine of 1.6. The kidney that produced that number stopped filtering at roughly that rate some time around 3 AM. By the afternoon the creatinine will be 2.2 and the team will reduce again, correctly, against a kidney that may by then be turning the other way. The level before the fourth dose will come back the next morning, drawn on time, reported on time, and already describing a different patient.
Protocol medicine will keep producing this result, because the protocol was written for a patient at steady state and your patients are never at steady state. The nomogram was right. The arithmetic was right. The dose was right for the kidney on the chart. The kidney on the chart had already moved.
RReferences
- 1.Moran SM, Myers BD. Course of acute renal failure studied by a model of creatinine kinetics. Kidney Int. 1985;27(6):928-937.
- 2.Chappell B, Suckling B, Pattullo C. Measuring and improving the timeliness of vancomycin therapeutic drug monitoring and potential patient safety impacts. Explor Res Clin Soc Pharm. 2024;13:100403.
- 3.Matzke GR, McGory RW, Halstenson CE, Keane WF. Pharmacokinetics of vancomycin in patients with various degrees of renal function. Antimicrob Agents Chemother. 1984;25(4):433-437.
- 4.Kwong YD, Chen S, Bouajram R, et al. The value of kinetic glomerular filtration rate estimation on medication dosing in acute kidney injury. PLoS One. 2019;14(11):e0225601.
- 5.Obara VY, Zacas CP, Carrilho CMDM, Delfino VDA. Currently used dosage regimens of vancomycin fail to achieve therapeutic levels in approximately 40% of intensive care unit patients. Rev Bras Ter Intensiva. 2016;28(4):380-386.
- 6.Hefny F, Stuart A, Kung JY, Mahmoud SH. Prevalence and risk factors of augmented renal clearance: a systematic review and meta-analysis. Pharmaceutics. 2022;14(2):445.
- 7.Campassi ML, Gonzalez MC, Masevicius FD, et al. Augmented renal clearance in critically ill patients: incidence, associated factors and effects on vancomycin treatment. Rev Bras Ter Intensiva. 2014;26(1):13-20.
- 8.Rybak MJ, Le J, Lodise TP, et al. Therapeutic monitoring of vancomycin for serious methicillin-resistant Staphylococcus aureus infections: a revised consensus guideline and review by ASHP, IDSA, PIDS and SIDP. Am J Health Syst Pharm. 2020;77(11):835-864.
- 9.Rybak MJ, Le J, Lodise TP, et al. Executive summary: therapeutic monitoring of vancomycin for serious methicillin-resistant Staphylococcus aureus infections. Clin Infect Dis. 2020;71(6):1361-1364.
- 10.Bai G, Qi H, Huang Y, et al. Predictive performance of Bayesian dosing software for vancomycin in intensive care unit patients. Ther Drug Monit. 2025;47(5):594-602.
- 11.Chu Y, Luo Y, Quan X, Jiang M, Zhou B. Intermittent vs. continuous vancomycin infusion for gram-positive infections: a systematic review and meta-analysis. J Infect Public Health. 2020;13(4):591-597.
- 12.Chertow GM, Lee J, Kuperman GJ, et al. Guided medication dosing for inpatients with renal insufficiency. JAMA. 2001;286(22):2839-2844.
- 13.Dale D, Asmamaw G, Etiso T, et al. Prevalence of inappropriate drug dose adjustment and associated factors among inpatients with renal impairment in Africa: a systematic review and meta-analysis. SAGE Open Med. 2023;11:20503121221150104.
- 14.Ma M, et al. Impact of pharmacist intervention on therapeutic drug monitoring of vancomycin: a meta-analysis. Front Pharmacol. 2026;17:1805469.
Declarations
Competing interests. The author is the founder of Aethryva Deeptech, which develops the tachyDx platform and the MOISSCode language. Where an article in this series mentions either, it says so in the text and the mention follows the argument.
Sources and figures. Every reference in this article is an open access source that any reader can open without payment. The figures were drawn by the author from the values printed in those sources, or are labelled as schematic where no published value exists. No patient data were used.
Cite this article
Kunche N. Vancomycin is being dosed against yesterday's creatinine. The Intervention. 8 October 2026. https://nikhilkunche.com/blog/vancomycin-is-being-dosed-against-yesterdays-creatinine
Comments